
Open a Nifty chart, add the Supertrend indicator, and the appeal is immediate. A single line tracks the price, sitting below it in a rise and jumping above it in a fall, and each jump lines up with a turn you wish you had traded. The line looks decisive. It looks like it knew. That hindsight is exactly the trap, because the flips that read so cleanly today were not clean in real time. A chart that has already happened cannot lose money.
A Supertrend strategy is the attempt to turn that line into a rule a machine can follow: go long when it flips up, reverse when it flips down, and repeat. The rule is simple to write. Whether it holds up is a separate question, and many parameter choices fail once costs, chop, and unseen data are added. This guide walks the full path in three steps, build, backtest, then validate, and treats every rule and every setting as a hypothesis to test rather than advice to follow. The validation step is the one that matters most and the one most traders skip.
A chart that has already happened cannot lose money.What Supertrend is and how it is computed
Supertrend is a trend-following indicator built on the Average True Range, and it plots directly on the price chart rather than in a panel below it. TradingView's reference describes it as "a trend-following indicator based on Average True Range (ATR)" created by Olivier Seban. The Average True Range itself, introduced by J. Welles Wilder in his 1978 book New Concepts in Technical Trading Systems, measures volatility as the average size of recent price ranges. Supertrend uses it to set how far the band sits from price, so the line breathes with the market: wider in turbulent stretches, tighter in calm ones.
The calculation is compact. Take the midpoint of each bar, the high plus the low divided by two, then add and subtract a multiple of the ATR to form an upper and a lower band, as TradingView sets it out. The visible Supertrend line is whichever band is currently active: while price holds above it the lower band trails beneath as support, and when the close crosses below, the line flips above price as resistance. Figure 1 shows the behaviour.
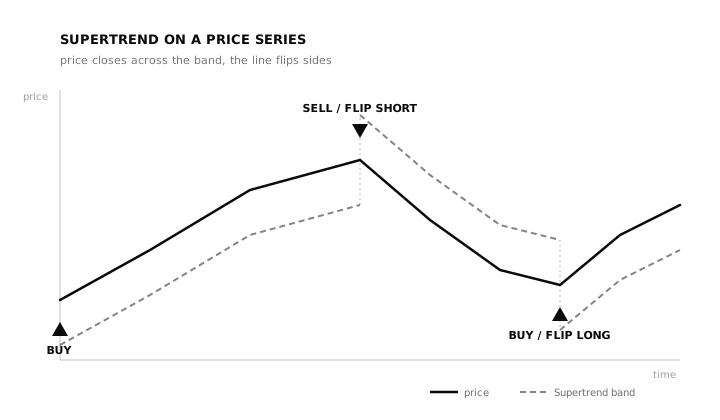
Figure 1: Supertrend trails below price in an uptrend and above it in a downtrend. Each flip, when the close crosses the active band, is the buy or sell signal the indicator is known for. Illustrative figures.
Two inputs shape everything: the ATR period, the lookback length used to measure volatility, and the multiplier, how many ATRs the band sits away from price. Charting platforms ship default values for both, but the defaults differ from platform to platform and carry no authority on their own. A larger multiplier widens the band, so the line flips less often and rides longer trends through more noise. A smaller one tightens it, catching turns sooner at the cost of more false flips. Neither is correct in the abstract. They are knobs to test, not settings to trust.
Building the strategy as a no-code rule set
A trading rule is a fully specified instruction with no room left for judgement, and Supertrend converts into one cleanly. The core, often called the always-in or stop-and-reverse version, is two lines: enter long when the close flips above the Supertrend line, and on the opposite flip, exit and enter short. The position is never flat; it is either long or short, reversing on each flip. That symmetry is what makes Supertrend a favourite for systematic testing, because there are no loose ends to fill in by hand.
Most traders test variants rather than the raw flip. A long-only version drops the short leg and sits in cash between uptrends, which suits instruments or accounts where shorting is awkward. A filtered version requires a second condition to agree before acting, for example a longer-period Supertrend or a higher timeframe pointing the same way, or a trend-strength reading such as the ADX clearing a threshold, on the theory that the flip is more reliable when a broader trend backs it. Some add an explicit stop-loss and target instead of waiting for the next flip. Each is a distinct hypothesis, and each needs to earn its place in a test, not in an argument.
They are knobs to test, not settings to trust.A platform's default values are a place to start a search, not a destination, because the period and multiplier that suit an intraday five-minute chart will whipsaw a positional daily one. None of this is a recommendation to trade Supertrend any particular way; it is a description of the rules a trader can specify and put to the test.
How to backtest a Supertrend strategy
A backtest replays the rule against historical data and reports what it would have done. The CFA Institute frames the exercise as estimating "how would this strategy have performed if it were implemented in the past." For a Supertrend rule, that means stepping bar by bar, flipping the position whenever the close crosses the line, and recording every entry, exit, and the running account balance.
The first thing to get right is costs. A stop-and-reverse Supertrend trades on every flip, and in a choppy session on a Nifty or Bank Nifty future it can flip several times in a few hours. Each round trip pays brokerage, the securities transaction tax, exchange and regulatory charges, GST, and slippage, the gap between the price the rule wanted and the price it got. A backtest that assumes free, instant fills can show a healthy gross result that costs erase entirely, and the more a rule trades, the wider that gap. A result that does not state whether it is net of costs is not one you can act on.
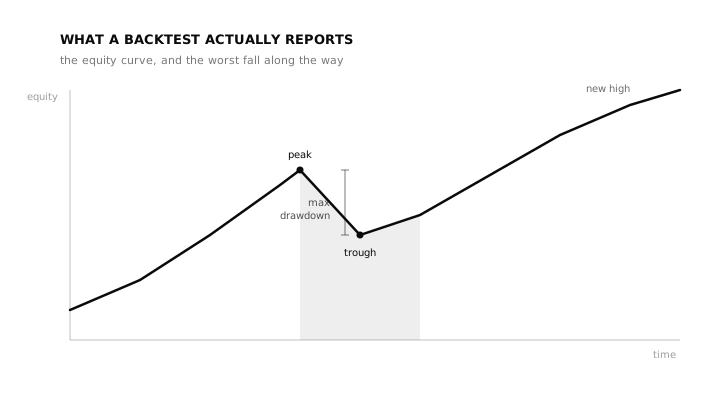
Figure 2: A backtest is more than a final number. The shape of the equity curve and the worst peak-to-trough fall along the way decide whether a rule is survivable in practice. Illustrative figures.
The metrics that matter come in pairs of reward and pain, as Figure 2 suggests. The compound annual growth rate, or CAGR, summarises the return, but it means little without the maximum drawdown, the largest peak-to-trough fall in the account, which is what a trader actually has to sit through. Risk-adjusted measures such as the Sharpe ratio, return per unit of volatility, and the Sortino ratio, which penalises only downside swings, put different strategies on a common footing. Win rate flatters trend systems less than people expect, because Supertrend tends to win small and often in trends and lose in clusters during chop, so expectancy, the average outcome per trade, is the more honest summary. A single unrealistic fill repeated across hundreds of flips can manufacture an edge that does not exist.
How to validate it
This is the step that separates a real edge from a flattering chart, and the reason a single good backtest proves almost nothing. Supertrend has only two parameters, which makes it easy to sweep dozens of combinations and keep the one with the best historical curve. That is precisely how a rule gets fitted to the noise of one stretch of history, a trap called overfitting. Bailey, Borwein, López de Prado, and Zhu showed in "Pseudo-Mathematics and Financial Charlatanism" that the more configurations you try, the more likely the best one is luck rather than skill. The winner of a parameter sweep is the most overfit setting in the set, not the most trustworthy.
Validation is the set of tests designed to catch that self-deception. The first is out-of-sample testing: hold back a slice of history the tuning never touches, fit the parameters on the rest, then test once on the untouched slice. An edge that survives data it has never seen is more believable than one measured on the same data it was tuned on. The stronger version is walk-forward analysis, shown in Figure 3, which rolls that split forward through time, repeatedly tuning on a window and testing on the next unseen one. It asks the harder question of whether the rule keeps working as conditions change, rather than whether it worked once.
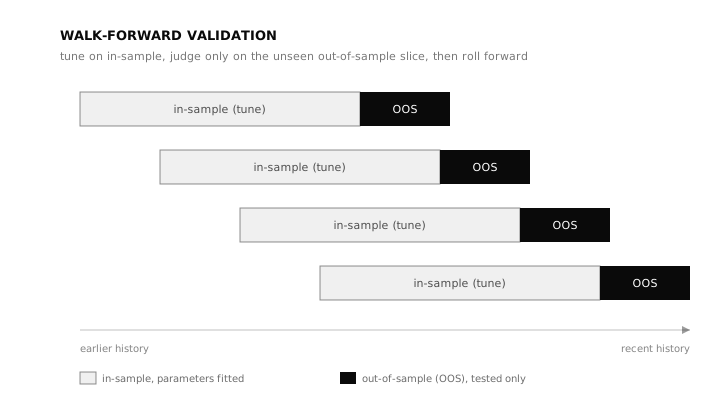
Figure 3: Walk-forward validation. Parameters are fitted on each in-sample window and judged only on the out-of-sample slice that follows, then the window rolls forward so the rule must keep earning its keep. Illustrative figures.
Two more tests round out the picture. A Monte Carlo simulation resamples or reorders the trade sequence thousands of times to show the range of outcomes the rule could have produced, so a trader sees how much of a single backtest was the luck of one path and how deep a drawdown the same rule could plausibly deliver. The look-ahead bias check, treated by Marcos López de Prado in Advances in Financial Machine Learning as a central threat to any backtest, confirms the rule acts only on a closed bar, never on information it could not have had in real time. Together these turn a backtest into strategy validation. Most Supertrend configurations that look excellent on one chart do not survive this, and learning that on a screen is the cheapest lesson available.
The winner of a parameter sweep is the most overfit setting in the set, not the most trustworthy.Limits and pitfalls
Supertrend's weakness is structural and well known: it is a trend-following tool, so it bleeds in markets that do not trend. In a sideways stretch the line flips back and forth across price, generating whipsaws, a run of false signals that each cost money and patience. Because the rule confirms a move only after the close crosses the band, it is also late by design, entering after a trend is underway and giving back part of it before the exit flip. That lag is the price of waiting for confirmation, not a flaw to optimise away.
That lag is the price of waiting for confirmation, not a flaw to optimise away.The subtler danger is the one validation exists to catch. With only two parameters, Supertrend is unusually easy to overfit, and a setting tuned to look perfect on the last two years is the least likely to repeat when volatility regimes shift. A Supertrend rule is a reasonable hypothesis. It is not a verdict, and the testing is what tells the two apart.
A checklist before you trust a Supertrend strategy
Before a Supertrend rule earns any capital, walk it through the same honest questions you would ask of any systematic edge.
| Checklist question | Why it matters |
|---|---|
| Did I define entry and exit rules before testing? | Prevents discretionary hindsight |
| Are brokerage, charges, and slippage included? | Prevents fantasy returns |
| Were the indicator's settings and thresholds chosen before testing? | Reduces curve-fitting |
| Did the rule survive out-of-sample data? | Tests whether it generalises |
| Did walk-forward results stay stable? | Tests parameter robustness |
| Did Monte Carlo show survivable drawdowns? | Tests sequence risk |
| Did I check how the rule behaves in sideways, low-volatility chop? | Supertrend whipsaws hardest when there is no trend to follow |
Frequently asked questions
What is a Supertrend strategy?
A rule set built on the Supertrend indicator, which flips a position long or short when the closing price crosses the ATR-based band. The basic version goes long on an upward flip and reverses on a downward flip, so the strategy is always in the market.
What are the best Supertrend settings?
There is no universally best setting, and treating any single pair as best is how strategies get overfit. A platform's default values are only a starting point to test. The right values depend on the instrument and timeframe, and must be confirmed with out-of-sample and walk-forward testing, not chosen because a chart looked good.
Does the Supertrend strategy work for intraday trading?
It can be configured for intraday use on lower timeframes, but it trades more often there, so costs and whipsaws weigh heavier. Whether a given intraday configuration holds up is an empirical question answered by a cost-aware backtest and validation, not by the indicator itself.
Why does Supertrend give false signals?
Supertrend is a trend-following indicator, so in sideways, range-bound markets price crosses the band repeatedly without a real trend forming, producing whipsaws. The lag from waiting for a bar to close also means some flips reverse soon after they trigger.
How do you validate a Supertrend strategy?
Test it on out-of-sample data the tuning never touched, roll that split forward with walk-forward analysis, and use Monte Carlo resampling to see the range of outcomes and drawdowns the rule could produce. Validation, run net of costs, is what distinguishes a genuine edge from a curve fitted to one lucky stretch of history.
Is a backtested Supertrend result a prediction of future returns?
No. A backtest describes how a rule behaved on historical data under stated assumptions. Past performance does not guarantee future results, and live conditions, costs, and market regimes can differ from the test.
The Supertrend flip is one of the clearest ideas in technical trading, which is exactly why it deserves the hardest testing. The line that looks so sure on a finished chart is a hypothesis until it survives data it has never seen. That survival is what daZh by Zudora is built to test: a no-code platform where a rule like this can be specified visually, backtested net of real costs, then put through parameter optimisation, walk-forward analysis, and Monte Carlo validation before a single rupee is committed. The goal is not a prettier backtest. It is an honest answer to whether an idea has earned the right to be traded.
Related guides
- RSI trading strategy: how to build, backtest, and validate it
- Moving average crossover strategy
- ADX trading strategy
- Walk-forward analysis and out-of-sample testing
- Overfitting and strategy validation
- Pillar: A framework for systematic trading
Disclaimer: daZh is a software platform for building, testing, and managing user-defined trading strategies. It does not provide investment advice, stock recommendations, guaranteed returns, or profit assurance. Backtests are based on historical data and assumptions; actual trading results may differ.
Sources
- TradingView, "Supertrend", indicator reference and documentation: definition, creator attribution, formula, and signal behaviour. https://www.tradingview.com/support/solutions/43000634738-supertrend/
- J. Welles Wilder, "New Concepts in Technical Trading Systems", Trend Research, 1978 (Average True Range). https://archive.org/details/newconceptsintec0000wild
- CFA Institute, "Backtesting and Simulation", CFA Program refresher reading, 2026 curriculum. https://www.cfainstitute.org/insights/professional-learning/refresher-readings/2026/backtesting-and-simulation
- David H. Bailey, Jonathan M. Borwein, Marcos López de Prado, Qiji Jim Zhu, "Pseudo-Mathematics and Financial Charlatanism: The Effects of Backtest Overfitting on Out-of-Sample Performance", Notices of the American Mathematical Society, 61(5), May 2014. https://papers.ssrn.com/sol3/papers.cfm?abstract_id=2308659
- Marcos López de Prado, "Advances in Financial Machine Learning", Wiley, 2018 (look-ahead bias, walk-forward and cross-validation). https://www.wiley.com/en-us/Advances+in+Financial+Machine+Learning-p-9781119482086