
Out-of-sample testing checks a trading strategy by splitting historical data into two parts and tuning the strategy on only one of them. The strategy is built on the first part, the in-sample data, then run once, untouched, on the second part, the out-of-sample data the rules have never seen. The result on that unseen stretch is the honest read on whether the edge is real or just fitted to the noise of the past. It matters because a strategy can always be polished until it explains history perfectly, and the only way to tell a genuine pattern from a flattering coincidence is to ask the rules to perform on data they could not have been shaped against.
Definition
"Out-of-sample testing evaluates a strategy on a held-back portion of historical data that played no part in building or tuning it, so the measured edge cannot be an artefact of fitting."
What out-of-sample testing is
Every strategy is born on some stretch of history. A trader notices a pattern, writes a rule, adjusts the parameters until the equity curve, the running line of cumulative profit and loss, looks convincing, and that stretch of data is now the in-sample period: the data the strategy was built and tuned on. The trouble is that a known past is easy to flatter. Given enough freedom over thresholds, lookback windows, and filters, a rule can be bent to fit almost any history, including the parts of it that were pure chance.
Out-of-sample testing answers the obvious objection. Before any tuning begins, a portion of the data is set aside and left untouched. The strategy is developed entirely on the in-sample part, then run a single time on the held-back out-of-sample part. Because those later observations played no role in choosing the rules, the strategy cannot have been fitted to them. Whatever performance shows up there is a cleaner read on how the strategy behaves on data it did not help choose, though it is still only one historical window.
The only way to tell a genuine pattern from a flattering coincidence is to ask the rules to perform on data they could not have been shaped against.The distinction is not cosmetic. An in-sample result blends genuine skill with memorisation of the past, and an out-of-sample result gives a cleaner test of whether the apparent skill survives on data the memorisation never touched.
How the train and test split works
The mechanics are a single, deliberate cut through time-ordered data. A common arrangement reserves the earlier majority of the history for in-sample work and holds back the most recent portion for the out-of-sample test, though the proportions vary with how much data is available. The cut runs in date order rather than at random, because a trading strategy lives in time and a shuffled split would let future information bleed backward into the training period.
The sequence is what gives the test its force. First, all the building happens on the in-sample side: every indicator, rule, and parameter is fitted there, and only there. Then the finished strategy, frozen exactly as it stands, is run once across the out-of-sample side. The CFA Institute, in its refresher reading on backtesting and simulation, describes models that are trained on in-sample data and validated on out-of-sample data precisely so the validation is independent of the fitting.
Out-of-sample testing asks whether the apparent skill survives on data the memorisation never touched.The single run is the whole point. The out-of-sample set is meant to be a one-way door. The moment its results are used to go back and adjust the rules, it stops being unseen, and the test quietly turns back into more in-sample fitting.
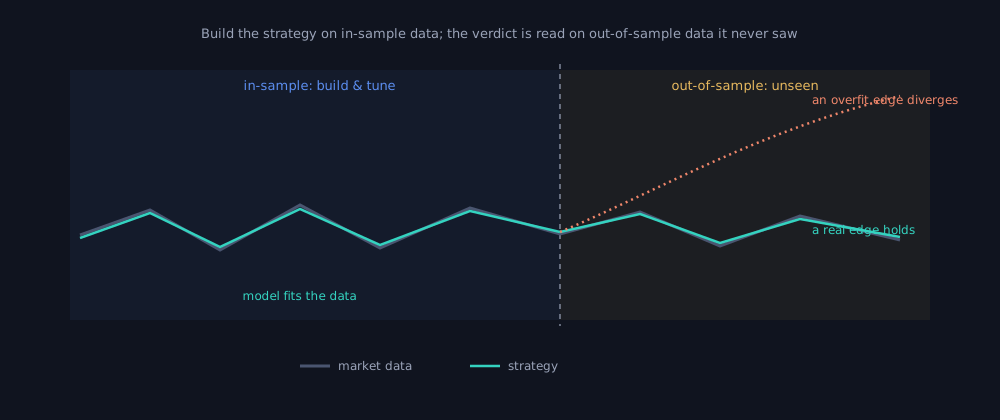
Figure 1: One history, one cut. The rule is fit on the in-sample side, then frozen and run on the unseen out-of-sample side, where it either holds its shape or comes apart.
How to read the result, and where walk-forward extends it
Figure 1 shows the two outcomes that matter. An edge that holds up across the out-of-sample stretch, with performance in the same neighbourhood as the in-sample run, has cleared one of the most important bars: its numbers came from data that took no part in choosing its rules, so they describe behaviour rather than memory. An edge that collapses on the unseen part is telling you the in-sample result was a fit to history rather than a pattern that persists. Reading the test is mostly reading that gap: a small, plausible drop is expected and healthy, while a result that evaporates the moment the data turns unfamiliar is a warning worth heeding.
A healthy out-of-sample result does not need to match the in-sample result perfectly. In fact, it usually should not. The in-sample period is where the strategy was discovered, adjusted, and selected, so its numbers are naturally flattered, and the out-of-sample period is expected to look rougher. The warning sign is not a small drop. The warning sign is a collapse.
| Metric | In-sample | Out-of-sample | Reading |
|---|---|---|---|
| CAGR | 34% | 22% | Weaker, but still alive |
| Sharpe ratio | 1.7 | 1.1 | Edge degraded, not destroyed |
| Maximum drawdown | 13% | 21% | Risk increased, but may be survivable |
| Win rate | 56% | 52% | Behaviour is broadly consistent |
| Average trade | ₹410 | ₹260 | Profitability survived the split |
Illustrative figures, not a real strategy or a recommendation.
A result like this does not prove the strategy will work live, but it gives the edge a reason to stay in the validation process. The shape survived: the numbers degraded, but they did not vanish.
A failure looks different in kind, not just in degree.
| Metric | In-sample | Out-of-sample |
|---|---|---|
| CAGR | 41% | -6% |
| Sharpe ratio | 2.1 | -0.3 |
| Maximum drawdown | 11% | 38% |
| Win rate | 59% | 44% |
Illustrative figures, not a real strategy or a recommendation.
This is not normal degradation. A profitable strategy turning loss-making, a Sharpe ratio crossing below zero, and a drawdown more than tripling are evidence that the strategy probably learned the past rather than the market. Figure 2 sets the two outcomes side by side.
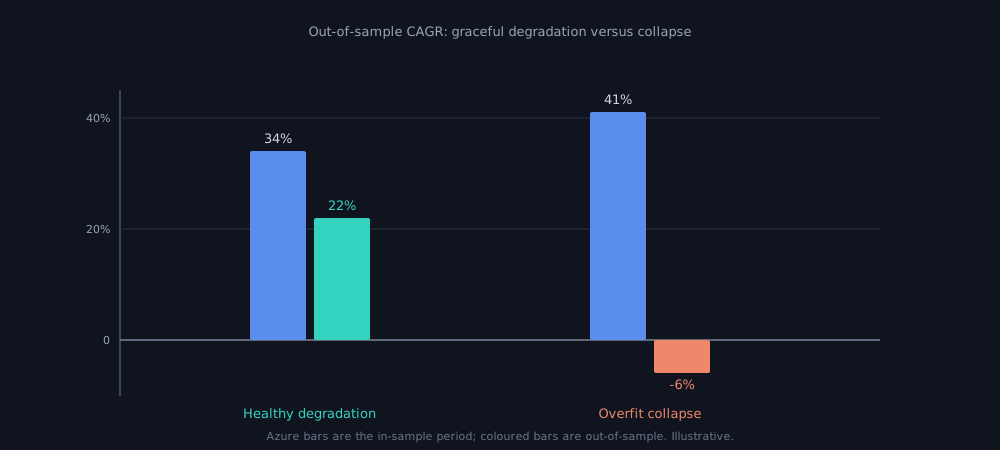
Figure 2: Graceful degradation versus collapse. A healthy edge gives back some return out of sample but stays positive; an overfit one falls through zero, the signature of a strategy that fitted the past rather than a pattern that persists.
A single split, though, only checks one unseen window, at one moment, under one set of conditions. Walk-forward analysis automates the same idea across the whole history. Instead of one cut, it rolls forward in steps, fitting on a window and then testing on the period just after it, again and again. The CFA Institute frames this rolling-window, or walk-forward, method as a proxy for actual investing, where signals are calibrated on a window, the portfolio is rebalanced, and performance is tracked forward.
Marcos López de Prado, in Advances in Financial Machine Learning, pushes the idea further still. His combinatorial cross-validation scores a strategy across many recombined train and test splits rather than a single ordered one, turning out-of-sample testing from a single draw into a check repeated dozens of times.
Limits and pitfalls
The real limit is that one split is a weak guard if the trader keeps peeking. Run the strategy on the out-of-sample data, dislike the result, return to the in-sample side to adjust a parameter, and run it again: after enough rounds, the held-back set has informed every choice and is no longer out of sample at all. This is the same overfitting the test was meant to catch, now smuggled in through the back door: a rule tuned so tightly to past data that it captures noise rather than a real pattern.
Peeking is the most visible form of a wider problem: data leakage, where information that should sit outside the in-sample period quietly informs the rules. It takes several forms:
- using future-adjusted data incorrectly, so prices carry information that was not available at the time;
- selecting indicators or features after looking at the full dataset;
- choosing the split date itself after seeing which cut flatters the result;
- tuning the universe of symbols around instruments that turned out to be winners;
- changing risk rules after seeing how the held-out period behaved.
Each one lets the held-back data influence a choice it was meant to judge, and each quietly turns an out-of-sample test back into in-sample fitting.
The cost of that habit is measurable. Bailey, Borwein, López de Prado, and Zhu, in "Pseudo-Mathematics and Financial Charlatanism", published in the Notices of the American Mathematical Society in 2014, show that high in-sample performance is easy to manufacture by trying a relatively small number of strategy configurations, and that the more configurations are tried, the greater the probability the backtest is overfit. Their sharper finding is that backtest overfitting leads to negative expected returns out of sample, not merely to zero: a strategy tuned hard enough against the past tends to do worse than nothing on what comes next.
A strategy tuned hard enough against the past tends to do worse than nothing on what comes next.There are quieter pitfalls too. An out-of-sample window that happens to be unusually calm or unusually wild can mislead either way, which is one reason a single pass is not a verdict. The test also cannot rescue a backtest whose assumptions were never realistic to begin with: if fills, costs, or available data were wrong on the in-sample side, they are wrong on the out-of-sample side as well. Out-of-sample testing checks that an edge generalises. It does not check that the edge was measured honestly in the first place.
The out-of-sample set is meant to be a one-way door.A checklist before you trust the result
Before trusting an out-of-sample result, ask:
- Was the split chosen before any tuning began?
- Was the out-of-sample period used only once?
- Were costs, slippage, and execution assumptions included before the split?
- Is the out-of-sample period long enough to contain enough trades to matter?
- Does it include more than one market regime?
- Did performance degrade naturally, or collapse completely?
- Was the strategy changed after seeing the out-of-sample result?
This is the kind of separation a serious validation layer should protect: build on one side, test once on the other, and only then decide whether the strategy deserves deeper checks such as walk-forward analysis, Monte Carlo simulation, and paper trading. That is the role daZh by Zudora is designed to play between a trading idea and live capital: it keeps the in-sample and out-of-sample sides separate, runs the held-back test as a clean single pass, and lets a strategy fail somewhere safe, on a test, rather than on an account.
Related concepts
- Overfitting: why a strategy tuned too hard to one stretch of history fits its noise, the exact failure out-of-sample testing is built to expose.
- Walk-forward analysis: how the single train and test split is automated into a rolling sequence of out-of-sample windows across the whole history.
- Strategy validation: the full sequence of checks, from an honest backtest through out-of-sample, Monte Carlo, and paper trading, that out-of-sample testing sits inside.
- Paper trading versus backtesting: the pillar explainer on testing a strategy on unseen conditions, including forward testing on live prices.
Disclaimer: daZh is a software platform for building, testing, and managing user-defined trading strategies. It does not provide investment advice, stock recommendations, guaranteed returns, or profit assurance. Backtests are based on historical data and assumptions; actual trading results may differ.
Sources
- CFA Institute, "Backtesting and Simulation", CFA Program refresher reading, 2026 curriculum. https://www.cfainstitute.org/insights/professional-learning/refresher-readings/2026/backtesting-and-simulation
- David H. Bailey, Jonathan M. Borwein, Marcos López de Prado, Qiji Jim Zhu, "Pseudo-Mathematics and Financial Charlatanism: The Effects of Backtest Overfitting on Out-of-Sample Performance", Notices of the American Mathematical Society, 61(5), May 2014, pp. 458 to 471. https://scholarworks.wmich.edu/math_pubs/40/
- Marcos López de Prado, "Advances in Financial Machine Learning", Wiley, 2018 (Chapter 12, "Backtesting through Cross-Validation"). https://www.wiley.com/en-us/Advances+in+Financial+Machine+Learning-p-9781119482086
- Investopedia, "Out-of-Sample Data", orientation reference, accessed June 2026. https://www.investopedia.com/terms/o/out-of-sample-data.asp