
Monte Carlo simulation in trading is a method that takes the trades a strategy produced and re-runs them thousands of times, each time in a different order or as a fresh random sample, turning one backtested equity curve into a distribution of possible outcomes. A backtest ends with a single equity curve, one line tracing how an account would have grown or shrunk if a strategy had run unchanged across history. That line feels definitive, but it is only one of the many paths the same set of trades could have drawn. Monte Carlo produces the rest, so a strategy can be judged by the full spread of results its trades could have generated.
Definition
"Monte Carlo simulation is a technique that uses repeated random sampling to generate many alternative versions of a result and reads the answer from the spread of those outcomes."
The method is older than finance. Nicholas Metropolis and Stanislaw Ulam formally introduced it in their 1949 paper in the Journal of the American Statistical Association. Metropolis had coined the name a few years earlier, after the casino in Monaco, and the two were solving physics problems that were too tangled to compute directly. Their insight was to substitute repeated random sampling for an exact calculation: generate many random trials, run each through the model, and take the answer from how the results scatter. A trading strategy is that kind of tangled problem. The order in which wins and losses arrive is uncertain, and a single history shows only one ordering.
The order in which wins and losses arrive is uncertain, and a single history shows only one ordering.What Monte Carlo simulation in trading is
A single backtest is one realized path through the market, lucky in some places and unlucky in others. The strategy fired a sequence of trades, and they happened to land in one particular order: a couple of winners, then a loser, then a long run of small gains. That order was not chosen by the strategy; it was set by the dates on which the trades happened to occur. Had the same trades arrived in a different sequence, the equity curve would have climbed and dipped at different moments, and its worst stretch could have been shallower or far deeper.
Monte Carlo simulation treats that sequence as one sample and builds many more. The common approaches, set out in the CFA Institute's refresher reading on backtesting and simulation, all reuse the trades the backtest already produced. Reordering, or permutation, shuffles the same trades into a new sequence, keeping every individual result but changing when each one occurs. Resampling, or bootstrapping, draws trades at random with replacement, building curves from a slightly different mix each time. A third approach perturbs the inputs themselves, nudging entry and exit timing or adding small variations to mimic the friction of live markets. Each run yields a complete alternative equity curve, and a thousand or more of them together form a distribution. The idea of resampling a strategy's own trades to judge it is well established in systematic trading: David Aronson's Evidence-Based Technical Analysis applies a Monte Carlo permutation test to trading rules, using the bootstrap to ask whether a backtested result could plausibly have come from a rule with no real skill.
That same reading places Monte Carlo a step beyond historical simulation. Historical simulation replays the past as it happened. Monte Carlo, it notes, runs in "a hypothetical environment specified by the user, rather than a historical setting," and the most consequential decision is "the choice of functional form of the statistical distribution of decision variables/return drivers." Choose that distribution badly and the simulation answers a question about a market that does not exist.
How the simulation builds a distribution
The mechanics are repetitive by design. Take the strategy's list of completed trades, apply one of the resampling rules, and compound the results into an equity curve. Record the numbers that matter from that curve: the final return, and the maximum drawdown, the deepest peak-to-trough fall the account suffered along the way. Then do it again, with a fresh random ordering, and again, until thousands of curves exist. Each curve is one plausible version of how the strategy could have performed.
The result is a spread of outcomes. The final returns scatter into a range, with a median and tails. More revealing, the maximum drawdowns form their own distribution, and it is usually wider and more alarming than the one figure the backtest reported. A practitioner reads it through percentiles: the median outcome, the 95th-percentile drawdown, the probability that the worst loss exceeds what the account can bear. The single backtested drawdown is buried somewhere inside that spread, and in many cases it may sit nearer the optimistic end than the middle.
The single backtested drawdown is buried somewhere inside that spread, and in many cases it may sit nearer the optimistic end than the middle.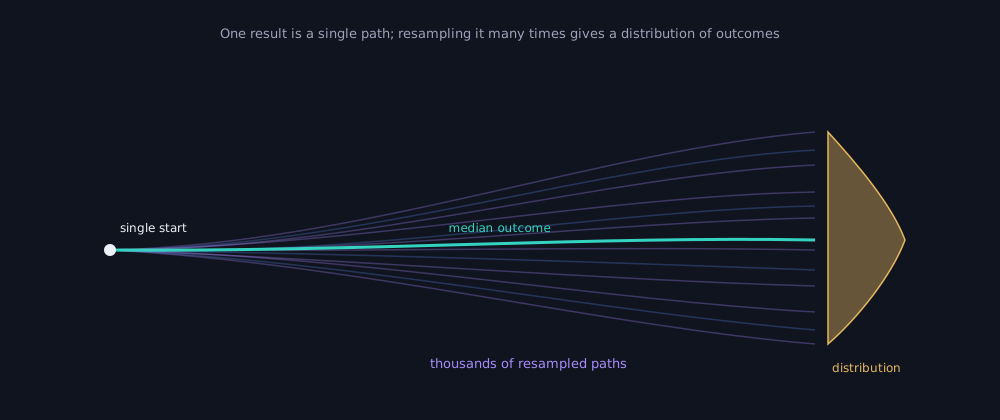
Figure 1: Many possible paths from one strategy. Each faint line is one resampled ordering of the same trades; together they fan into a distribution, with the highlighted band marking the central range of outcomes.
Figure 1 captures why a single line can mislead. The lone equity curve a backtest draws is one thread inside that fan. It might run along the bright central band, or it might be one of the fortunate paths near the top edge. Only the full spread shows where it actually sits, and how far the unlucky paths fall.
How to read what it reveals
The distribution of maximum drawdown is the output most worth studying, because a deeper-than-expected drawdown is what forces a trader to abandon a strategy. A trader sizing positions against a backtested worst loss of, say, a tenth of the account is sizing against one of the milder histories the trades could have produced. If the simulation shows that reorderings of the same trades regularly produce drawdowns two or three times deeper, the real question is whether the account, and the person running it, could survive that without abandoning the strategy at the bottom.
The distribution of maximum drawdown is the output most worth studying, because a deeper-than-expected drawdown is what forces a trader to abandon a strategy.Read this way, Monte Carlo is a test of robustness to the sequence of trades. A strategy whose outcomes stay profitable and tightly clustered across thousands of reorderings has stronger evidence of robustness: its result depends less on the exact timing of wins and losses. Tight clustering on its own proves nothing. Outcomes can cluster just as tightly around a mediocre or losing result, so what matters is that the cluster sits in profitable territory. One whose attractive backtest sits at the lucky extreme of a wide, ugly distribution has shown that its headline result depended heavily on a favourable order. Neither finding is a forecast. The simulation describes a range of pasts that could have occurred, which is a more honest basis for judging risk than the single past that did.
What numbers to look at
A Monte Carlo output is useful only if it changes how the strategy is judged. The figures that matter are not the best simulated outcome but the uncomfortable ones: the median return, the 5th-percentile return, the median maximum drawdown, the 95th-percentile maximum drawdown, and the probability that drawdown crosses the trader's loss limit.
| Output | What it tells you |
|---|---|
| Median final return | The middle outcome across all simulated paths |
| 5th-percentile final return | A poor-but-plausible return outcome |
| Median maximum drawdown | The typical worst fall across simulated paths |
| 95th-percentile maximum drawdown | A severe drawdown that still appears within the simulation |
| Probability of breaching loss limit | How often the strategy falls beyond the trader's survivable range |
The point is not to ask whether the best path looks attractive. It is to ask whether the ugly but plausible paths are still survivable.
In practice, the contrast between the original backtest and the simulation looks like this, where the unlucky-tail column reads the 5th-percentile return and the 95th-percentile drawdown.
| Metric | Original backtest | Monte Carlo median | Monte Carlo, unlucky tail |
|---|---|---|---|
| Final return | 42% | 35% | 8% |
| Maximum drawdown | 12% | 18% | 34% |
| Time underwater | 2 months | 4 months | 11 months |
Illustrative figures, not a real strategy or a recommendation.
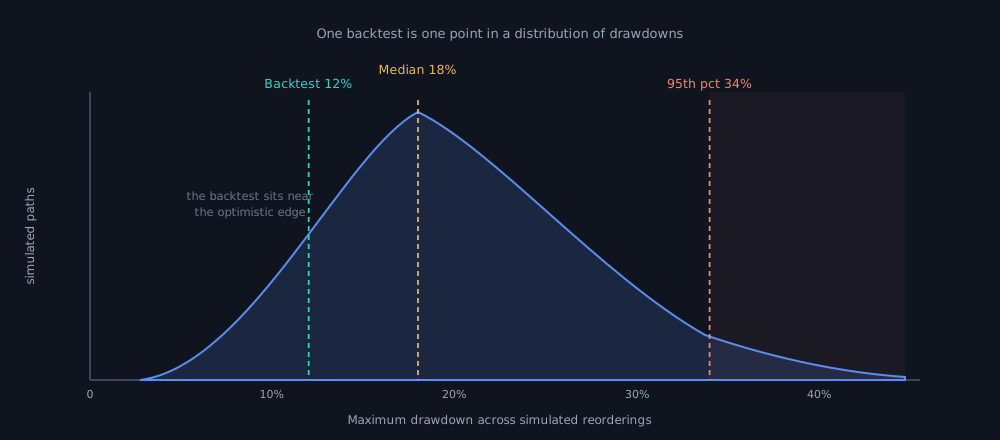
Figure 2: One backtest is one point in a distribution. The backtested 12% drawdown sits near the optimistic edge of the simulated drawdowns; the median reordering is deeper, and the 95th-percentile tail is deeper still.
The original backtest did not lie, but it was only one path. The simulation shows that the same trade logic could have produced a much harder ride: a return closer to a third than to a half, a drawdown that plausibly reaches a third of the account, and a stretch underwater measured in many months rather than weeks.
Limits and pitfalls
The honest boundary of the method is simple: it resamples the same historical trades, so it cannot create information the data never held. Every alternative curve is built from the trades the original strategy produced. If that strategy was overfit to the quirks of one stretch of history, every reordering inherits the overfit, and the simulation will reassure rather than warn. Marcos López de Prado makes the related point in Advances in Financial Machine Learning: a result resting on a single historical sequence is easily overfit, and resampling that one sequence does not escape it. Monte Carlo only re-examines the one history it was given; it adds no new data.
A further caution applies to the perturbation approach: it only tests what the user chose to vary. A simulation is only as truthful as the backtest beneath it and the distribution assumed above it. It sharpens the reading of an edge that is already real, and it cannot rescue one that is not.
It sharpens the reading of an edge that is already real, and it cannot rescue one that is not.A checklist before you trust the result
Before trusting a Monte Carlo simulation, ask:
- Were trades resampled, reordered, or were the inputs perturbed?
- Were transaction costs and slippage already included in the original backtest?
- Are trades independent enough for naive shuffling to make sense, or should consecutive trades be resampled in blocks?
- What happens at the 95th or 99th percentile drawdown?
- Does the strategy survive your actual capital and your psychological loss limit?
- Is the original backtest realistic, or is Monte Carlo only resampling an overfit illusion?
This is the kind of robustness check a serious validation layer should surface before live deployment, and it is one of the checks daZh by Zudora is designed around. It sits between a trading idea and live capital: a strategy that has cleared a realistic backtest is resampled into a distribution, so its drawdown is judged across the range of orderings it could have faced. A result that survives that scrutiny still carries no guarantee, but it has shown how much the strategy leaned on a lucky sequence of trades.
Related concepts
- Strategy validation: the full sequence of checks that Monte Carlo simulation sits inside, from a realistic backtest to paper trading.
- Overfitting: why a flattering backtest can be a fit to noise, and why resampling it cannot fix that.
- Drawdown: the peak-to-trough loss whose distribution is Monte Carlo's most useful output.
- Walk-forward analysis: the rolling out-of-sample test that checks an edge across time before it is resampled.
- How to choose the best algo trading platform: where robustness testing fits into picking the tools that run the validation chain.
Disclaimer: daZh is a software platform for building, testing, and managing user-defined trading strategies. It does not provide investment advice, stock recommendations, guaranteed returns, or profit assurance. Backtests are based on historical data and assumptions; actual trading results may differ.
Sources
- Nicholas Metropolis and Stanislaw Ulam, "The Monte Carlo Method", Journal of the American Statistical Association, Vol. 44, No. 247, September 1949, pp. 335 to 341. DOI: 10.1080/01621459.1949.10483310. https://www.tandfonline.com/doi/abs/10.1080/01621459.1949.10483310. Free full text: https://www.dam.brown.edu/people/dem/0123017505/MetropolisUlamJASA1949.pdf
- CFA Institute, "Backtesting and Simulation", CFA Program refresher reading, 2026 curriculum. https://www.cfainstitute.org/insights/professional-learning/refresher-readings/2026/backtesting-and-simulation
- Marcos López de Prado, "Advances in Financial Machine Learning", Wiley, 2018. https://www.wiley.com/en-us/Advances+in+Financial+Machine+Learning-p-9781119482086
- David Aronson, "Evidence-Based Technical Analysis: Applying the Scientific Method and Statistical Inference to Trading Signals", Wiley, 2006. DOI: 10.1002/9781118268315. https://onlinelibrary.wiley.com/doi/book/10.1002/9781118268315