
A backtest can look too good. A trader tries a moving-average rule, the equity curve climbs but wobbles, so the trader nudges the lookback from 20 days to 23, adds a filter, loosens a stop, and after a few hours the curve is smooth and the returns are large. The strategy now describes the past almost perfectly. Traders often read that perfection as a prize. It is a warning sign, and the name for it is overfitting.
Definition
"Overfitting is when a strategy is tuned to the quirks of one stretch of history rather than a durable signal, so it looks excellent in a backtest and then fails on new data."
Overfitting is what happens when a strategy is shaped so closely to one sample of history that it captures the random quirks of that sample rather than any durable market pattern. The past is fixed and full of coincidence. Fit a rule tightly enough and it starts to memorise those coincidences, the lucky days and the noise, mistaking them for signal. As Bailey, Borwein, Lopez de Prado and Zhu wrote, the strategy is "not capitalizing on any general financial structure but is simply highlighting vagaries in the data". It looks like skill, but it is only a close copy of one stretch of history.
This matters because the test most traders trust most is the one overfitting corrupts. A backtest is meant to answer whether an idea ever had an edge. An overfit backtest answers a different question: how well a rule can be bent to match this exact stretch of history. The two look identical on screen. Only live capital, or honest validation, tells them apart.
Why an overfit strategy looks brilliant, then breaks
The gap between a backtest and live trading is the gap between a known past and an unknown future. History is one realisation of a noisy process. Inside it sit patterns that will recur and patterns that were pure chance. A strategy with enough freedom can fit both, and from inside the backtest there is no visible difference between the two. The result that a strategy posts on the data it was built from is its in-sample performance; what it posts on data held back from that building is its out-of-sample performance, and the two can diverge sharply.
When the same strategy meets fresh data, the chance patterns do not repeat, because they were never real. The performance that depended on them evaporates. What remains is whatever genuine edge existed, often far less than the backtest promised, sometimes nothing at all. The strategy did not change. The data did, and the part of its performance that was fitted to noise had nowhere to hide.
It looks like skill, but it is only a close copy of one stretch of history.The scale of the trap is well documented. In their 2014 paper in the Notices of the American Mathematical Society, David Bailey, Jonathan Borwein, Marcos Lopez de Prado and Qiji Zhu showed that high simulated performance is easy to manufacture by testing a relatively small number of strategy variations. On a model built from five years of daily data, as few as about 45 configurations may be enough for at least one to look excellent on the sample purely by chance, with no real edge behind it. Forty-five configurations is not many; a few hours with a spreadsheet can exceed that count before a trader registers that a search took place.
How overfitting is built into a backtest
Overfitting is rarely a single mistake. It builds from a few ordinary habits, each reasonable on its own, that compound when they sit together in the same workflow.
One is too many parameters. Every tunable knob (a lookback, a threshold, a stop) is a degree of freedom the strategy can use to wrap itself around the data. A rule with two parameters can only bend so far. A rule with a dozen can contort to fit almost any history, and the fit it finds is increasingly a fit to noise. Complexity can feel like sophistication, but in a backtest it is mostly extra room to memorise.
Another is repeated trials against the same data. Each variation tested on one history is a fresh lottery ticket against the same draw. Test enough of them and one will win on luck alone. This is why the Bailey paper's count matters: the real danger is the dozens of quiet attempts behind whichever strategy is finally kept. The probability of selecting an overfit strategy grows rapidly with the number of trials, and most traders never count their trials.
The probability of selecting an overfit strategy grows rapidly with the number of trials.The most damaging habit is optimising on the data meant to check the result. The CFA Institute groups several of these failures under data snooping, look-ahead bias, and survivorship bias: choosing a model because it scored well on the test set, letting in information that was not available at the time, or running on a universe that quietly excludes the instruments that failed. Each one lets the past leak knowledge it could not have had. The backtest stops being a test and becomes a mirror.
Figure 1 shows the shape of the failure. A flexible model traces every wiggle of the in-sample curve, then diverges sharply once the unseen data begins, because the wiggles it learned were never going to repeat.
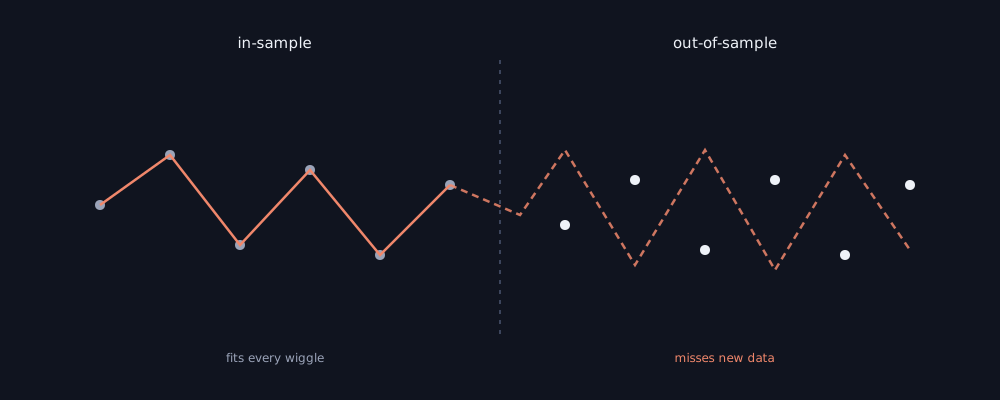
Figure 1: An overfit model hugs the noise of the in-sample data, then diverges once the data is unseen. The closer the in-sample fit, the wider the out-of-sample gap tends to be.
How to recognise overfitting in a backtest
Overfitting rarely announces itself; it hides inside a result that looks better than it is. A handful of red flags, read together rather than in isolation, are usually enough to make a backtest worth a second look.
| Red flag | What it means |
|---|---|
| Very high in-sample return | The strategy may have fit the sample too closely |
| Many parameters | More room to memorise noise |
| Repeated optimisation | More chances to find a lucky configuration |
| Huge in-sample versus out-of-sample gap | The edge may not generalise |
| Very low drawdown in the backtest | Risk control may itself be curve-fitted |
| No record of the trial count | The final result hides the search behind it |
No single flag proves overfitting, but two or three together are a strong sign that a backtest is describing the past rather than a pattern that will repeat.
The clearest tell is the gap between in-sample and out-of-sample performance. Set a clean strategy beside an overfit one and the difference is stark.
| Metric | Clean strategy | Overfit strategy |
|---|---|---|
| Parameters | 3 | 17 |
| Configurations tried | 8 | 240 |
| In-sample CAGR | 24% | 62% |
| Out-of-sample CAGR | 18% | -4% |
| Max drawdown out of sample | 16% | 41% |
| Interpretation | Degraded but alive | Fitted to history |
Illustrative figures, not a real strategy or a recommendation.
The overfit strategy has the better backtest by far, a 62% in-sample CAGR against 24%, and the worse future, a return that turns negative the moment the data is unfamiliar. The clean strategy gives back some return out of sample but stays profitable. Figure 2 shows why the two diverge: as a strategy is handed more parameters and more attempts, its in-sample result keeps climbing while its out-of-sample result peaks and then falls away.
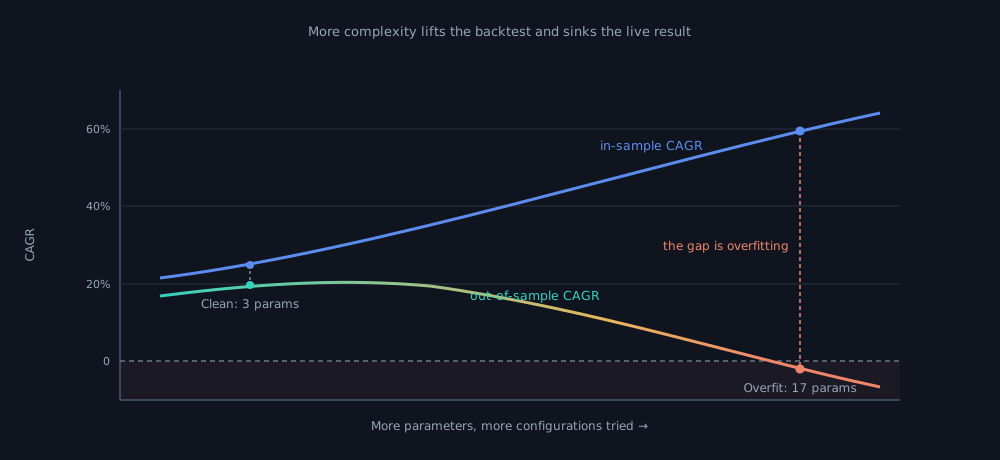
Figure 2: More complexity lifts the backtest and sinks the live result. Beyond a point, every extra parameter or trial buys in-sample performance the strategy cannot keep out of sample, and the widening gap between the two lines is the overfitting itself.
The defences, and why they are uncomfortable
The defences against overfitting are well known. Each one tends to lower the headline number that overfitting inflates.
Hold out data the strategy never sees while it is being built. Out-of-sample testing splits history so the strategy is tuned on one part and judged on another, and walk-forward analysis does this in moving windows, optimising on a stretch and testing on the period that follows, repeatedly, the way live trading actually unfolds. A strategy that survives data it was not fitted to has shown something a single all-history backtest cannot. The discomfort is real: out-of-sample results are usually worse than in-sample ones, which is exactly the point.
Out-of-sample results are usually worse than in-sample ones, which is exactly the point.Use fewer parameters. A simpler rule has less room to memorise and tends to carry whatever edge it has into new conditions more reliably than an ornate one. When two strategies fit the past equally well, the one with fewer moving parts is the safer bet on the future, because a smaller share of its result depends on coincidences that will not recur.
Be honest about how many variations you tried. The single most underreported number in a backtest is the count of configurations tested before this one was kept. That count is what turns a respectable result into a likely fluke, and it is invisible in the final equity curve. Recording it, and resisting the urge to keep tuning until the curve smooths, is less a technique than a discipline. As the Bailey paper put it, much of the reason systematic strategies fail to live up to the expectations their backtests generate is precisely this unreported search.
The single most underreported number in a backtest is the count of configurations tested before this one was kept.These defences are the substance of strategy validation: deliberately testing whether a backtest's result survives outside the data it was built on. They connect to the next test in the sequence too, since a strategy that survives out-of-sample data is what earns a forward run, the subject of paper trading versus backtesting. The same scepticism shapes how to choose an algorithmic trading platform: the tools worth using are the ones that make honest validation easy and overfitting hard.
A checklist before you trust a backtest
Before trusting a backtest, ask:
- How many strategy variations were tried before this one was kept?
- Were the parameters chosen before seeing the final result?
- Was the out-of-sample data used only once?
- Did the strategy survive walk-forward testing?
- Are the costs, slippage, and execution assumptions realistic?
- Does the strategy still work if the parameters are moved slightly?
- Is the result driven by one regime, one stock, or one lucky period?
From a clean curve to a tested idea
A perfect backtest is not evidence of a good strategy. It is evidence that a strategy has been fitted closely to the past, and closeness of fit and quality of edge are not the same thing. The discipline is to treat a flawless curve with suspicion and to ask, of any backtest, how much of the result is signal and how much is noise that happened to look like signal.
That question does not have a comfortable answer, but it has a method. Out-of-sample and walk-forward testing, restraint with parameters, and an honest tally of trials will not turn a bad idea into a good one. They will stop a noisy one from masquerading as a winner until live money exposes it. The goal is to be disappointed on a test set, where disappointment is cheap, rather than in the account, where it is not.
Building that scepticism into the test itself is the harder part. Putting walk-forward validation, parameter optimisation that reports its own search, and out-of-sample checks between a trading idea and live capital, so an overfit curve is caught before it costs anything, is what daZh by Zudora is built around. A backtest can describe the past, but the validation around it is what decides whether that description was ever worth trusting.
Related concepts
- Out-of-sample testing, the first defence against fitting to noise.
- Walk-forward analysis, out-of-sample testing rolled forward over time.
- Monte Carlo simulation, a robustness check against a lucky path.
- Strategy validation, the full sequence overfitting threatens.
- Paper Trading vs Backtesting.
Disclaimer: daZh is a software platform for building, testing, and managing user-defined trading strategies. It does not provide investment advice, stock recommendations, guaranteed returns, or profit assurance. Backtests are based on historical data and assumptions; actual trading results may differ.
Sources
- David H. Bailey, Jonathan M. Borwein, Marcos Lopez de Prado, Qiji Jim Zhu, "Pseudo-Mathematics and Financial Charlatanism: The Effects of Backtest Overfitting on Out-of-Sample Performance", Notices of the American Mathematical Society, May 2014. https://papers.ssrn.com/sol3/papers.cfm?abstract_id=2308659
- American Mathematical Society (distributed via EurekAlert!), "Pseudo-mathematics and financial charlatanism", press release on the Bailey, Borwein, Lopez de Prado and Zhu study, April 10, 2014. https://www.eurekalert.org/news-releases/817304
- CFA Institute, "Backtesting and Simulation", CFA Program refresher reading, 2026 curriculum. https://www.cfainstitute.org/insights/professional-learning/refresher-readings/2026/backtesting-and-simulation