
A trader watches a Nifty stock break out of weeks of sideways chop and run hard for ten sessions. Scrolling back, the pattern looks obvious: the moves worth holding had real force behind them, while the frustrating losses came from chasing breakouts that fizzled inside a range. The next thought starts almost every indicator strategy: what if a number could tell the strong trends from the weak ones, before the trade. The Average Directional Index, or ADX, is built to answer exactly that. A number that looks useful on a chart you have already seen is not yet a strategy. It is a hypothesis that has to be tested before it earns any money.
This guide walks the full path for one of the most widely used trend indicators in technical analysis: what ADX is, how to turn it into a no-code rule set, how to backtest it with realistic costs, and, most importantly, how to validate it so a single flattering backtest is not mistaken for an edge. Throughout, every rule is a configuration to test, never a recommendation to trade.
A number that looks useful on a chart you have already seen is not yet a strategy.What the Average Directional Index is
ADX measures one thing only: the strength of a trend, regardless of which way it points. It was developed by J. Welles Wilder Jr. and published in his 1978 book New Concepts in Technical Trading Systems. ADX never travels alone. It is the third line of Wilder's directional movement system, read together with two companions that do carry direction: the Plus Directional Indicator (+DI) and the Minus Directional Indicator (-DI).
The construction follows a fixed sequence, documented in the StockCharts reading of the directional movement system. For each period it measures directional movement, the +DM and -DM, from how far today's high and low extend beyond yesterday's. Those are smoothed and divided by the average true range to give the +DI and -DI lines on a 0 to 100 scale; the gap between them, as a proportion of their sum, is the directional index, and ADX is that index put through Wilder's smoothing, with a 14-period lookback used throughout.
Two properties matter for anyone building a rule. First, ADX is non-directional: it gauges trend strength, not which way price is moving, which is what +DI and -DI are for. Second, ADX lags, confirming strength only after a trend has established itself rather than predicting it. By common trading convention, ADX above 25 is often treated as a trend-strength filter, below 20 as weak or no trend, and 20 to 25 as a gray zone, per the StockCharts reading of the system. Those are the raw materials a computer can test without ambiguity.
How to build the ADX strategy as a rule set
A chart observation becomes a strategy only when every decision is written as an explicit, testable rule. No-code platforms let a trader express that as conditions and actions, no programming required, but the discipline is the same as writing code. Leave nothing to interpretation.
The textbook starting configuration uses ADX as a filter on a directional signal. The rule set has four parts a backtest can execute exactly:
- Indicator: ADX with a 14-period lookback, plus the +DI and -DI lines, on a chosen timeframe.
- Entry: enter long when +DI crosses above -DI while ADX is above 25, a directional move backed by trend strength.
- Exit: exit when -DI crosses back above +DI, or when ADX falls below 25 and the trend is judged to have faded.
- Risk: a position size and a stop-loss defined before the test, not after.
Figure 1 shows this rule set on a price series, the entry marked where +DI climbs above -DI while ADX holds above the 25 line.
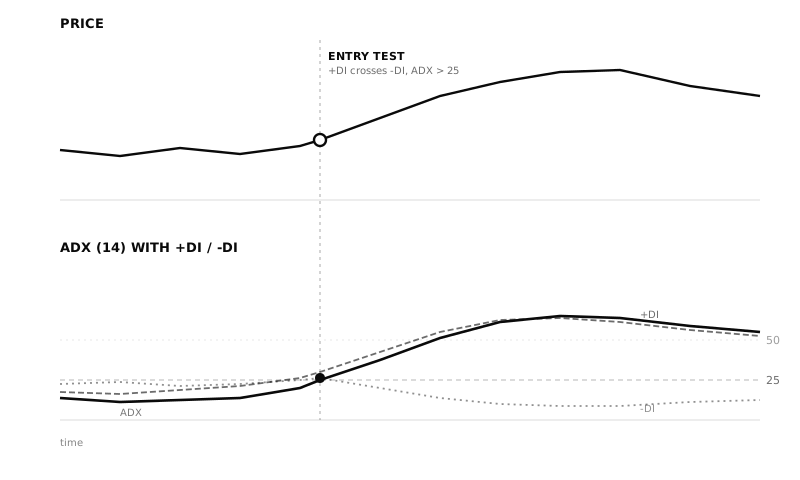
Figure 1: The standard ADX rule set, a +DI over -DI crossover taken only when ADX confirms trend strength above 25. Illustrative figures.
That is one hypothesis, not the only one, and the common variants behave very differently. Some traders use ADX purely as a regime filter, gating a separate trend system to ADX above a threshold; others act on its slope, reading a rising line as strengthening trend and a falling one as exhaustion. The threshold is itself a parameter: 20, 25, and 30 each demand a different conviction, and Wilder's scale runs further, above 40 read as strong and above 50 as extremely strong. Each variant is a separate hypothesis, and the temptation is to treat whichever looks best on the chart as the answer rather than as one more configuration waiting to be tested. None of these is advice to trade. They are inputs to an experiment.
Leave nothing to interpretation.How to backtest it
A backtest replays the rule set against historical data and reports what it would have done. The point is not to admire the result. It is to find the strategy's flaws on a screen, cheaply, before the market finds them with real money.
The first thing separating a useful backtest from a misleading one is cost. Every real trade pays brokerage, statutory charges, exchange and regulatory fees, and slippage, the gap between the price a rule targets and the price it fills at. An ADX strategy clusters its trades around breakouts and trend turns, exactly when spreads widen and fills drift, so slippage bites harder than a calm backtest assumes. A run with costs at zero measures an edge no account could capture; the honest version deducts realistic costs and slippage on every fill.
The second is reading the right numbers. A single return figure hides what decides whether a strategy is survivable; the metrics that matter sit alongside it:
| Metric | What it tells you |
|---|---|
| Net return after costs | The result an account could actually have kept |
| Maximum drawdown | The deepest peak-to-trough fall, the pain you must sit through |
| Sharpe ratio | Return earned per unit of volatility taken |
| Win rate and expectancy | How often it wins, and the average outcome per trade |
| Number of trades | Whether the result rests on a large enough sample to mean anything |
Trend-following rules carry a shape the numbers reveal: a modest win rate paired with a few large winners, because the strategy waits through many small losses for the rare strong trend. Figure 2 shows why drawdown belongs next to return: a backtested equity curve can rise overall yet still pass through a fall deep enough to end the experiment in real life, where a trader has to live through it.
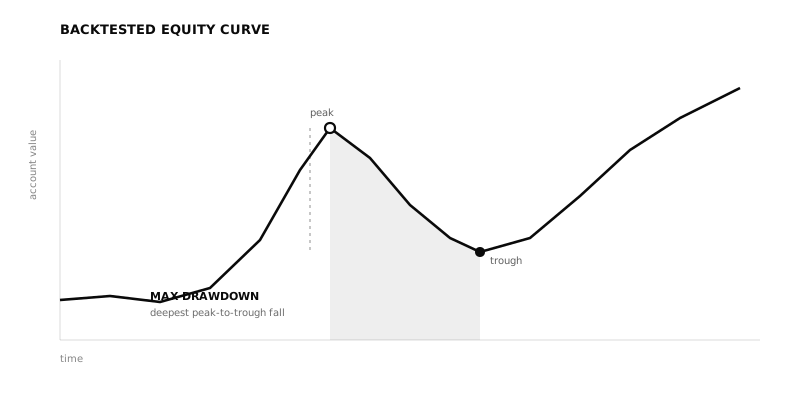
Figure 2: A backtested equity curve read honestly. The headline is the rise; the number that decides survivability is the depth of the worst drawdown. Illustrative figures.
A clean backtest with costs, slippage, and a full trade record is necessary but not sufficient. A good-looking single backtest is the most common reason an indicator strategy fails live, because it can look good by luck.
It is to find the strategy's flaws on a screen, cheaply, before the market finds them with real money.How to validate it
Validation separates a strategy worth deploying from one that merely looked good once, and it is the step most traders skip. The reason it matters is uncomfortable: if you test enough versions of an ADX rule, thresholds, lookbacks, timeframes, stops, one will fit the random noise in your sample and post an excellent result by chance. This is overfitting, and Bailey, Borwein, López de Prado, and Zhu showed in "Pseudo-Mathematics and Financial Charlatanism" that the more configurations you try, the more likely the winner is luck rather than edge. The fix is to make the strategy prove itself on data it was never tuned on.
The first guard is out-of-sample testing. Split the history. Tune the rule on one part, then test it once on a later part it has never seen. An edge that survives the unseen window has stronger evidence behind it than one that only shines on the data it was fitted to.
The stronger guard is walk-forward analysis, shown in Figure 3. Instead of one split, the test rolls forward in steps: tune on a stretch, test on the next, move the window, repeat. The out-of-sample results stitch into a single track record no tuning period ever saw whole. If the best ADX threshold swings from 22 in one window to 35 in the next, that instability is itself the verdict: the edge was a fit to history, not a feature of the market.
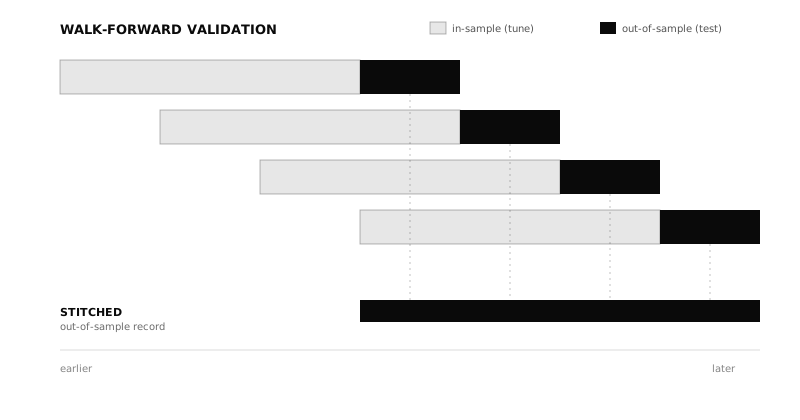
Figure 3: Walk-forward validation. Parameters are tuned in-sample, then tested out-of-sample, repeatedly, so the record that counts is built only from data the rules never saw during tuning. Illustrative figures.
The third guard probes luck of sequence. Monte Carlo simulation resamples the order and selection of trades many times to produce a range of outcomes rather than one path. It answers what a single backtest cannot: how much of the result depended on a fortunate order of trades, and how deep the drawdown could have run with the same trades in a different sequence, which matters for a trend rule whose record can hang on a handful of large winners. Taken together, out-of-sample, walk-forward, and Monte Carlo turn a backtest into strategy validation. One good backtest is a claim. A strategy that clears all three has earned a hearing.
One good backtest is a claim.Limits and pitfalls
ADX is a tool, not an oracle, and its known weaknesses are part of the strategy. The most important is lag: because a trend has to establish itself before ADX rises above 25, a rule that waits for confirmation enters late, after part of the move is gone, and can be whipsawed if the trend stalls. The mirror problem is the chop in between, where ADX sits low and the directional lines cross back and forth, so a rule not gated by the strength filter fires a stream of false signals. An ADX strategy not tested across both trending and ranging periods has not really been tested.
The second pitfall is parameter overfitting, the trap Figure 3 is built to expose: sweeping thresholds and lookbacks until the equity curve looks perfect is not optimisation but curve-fitting, and the prettier the in-sample curve, the more suspicious it should make you. The third is cost blindness, because ADX rules cluster activity at breakouts and reversals, leaving them unusually exposed to slippage and statutory charges, so a result that ignores them can invert once they are included. None of these makes ADX useless; they make the testing non-negotiable. The honest summary is that an indicator rule is a hypothesis, and most hypotheses do not survive honest validation.
A checklist before you trust an ADX strategy
Before trusting an ADX rule with real capital, run it past these questions.
| Checklist question | Why it matters |
|---|---|
| Did I define entry and exit rules before testing? | Prevents discretionary hindsight |
| Are brokerage, charges, and slippage included? | Prevents fantasy returns |
| Was the ADX threshold chosen before testing? | Reduces curve-fitting |
| Did the rule survive out-of-sample data? | Tests whether it generalises |
| Did walk-forward results stay stable? | Tests parameter robustness |
| Did Monte Carlo show survivable drawdowns? | Tests sequence risk |
| Does the strategy work across trending and ranging regimes? | ADX can fail badly in chop |
Frequently asked questions
What is the standard ADX strategy?
The most cited starting point reads ADX alongside the directional lines: using a 14-period setting, enter long when +DI crosses above -DI while ADX is above 25, and exit when -DI crosses back above +DI or ADX falls below 25. It is a hypothesis to test, not a recommendation.
What does ADX above 25 mean?
By the common convention, an ADX reading above 25 marks a trend strong enough to act on, while a reading below 20 suggests no meaningful trend, with 20 to 25 a gray zone. ADX shows trend strength only, not direction; the +DI and -DI lines show which way price is moving.
What ADX settings did Wilder use?
J. Welles Wilder, who introduced ADX in his 1978 book New Concepts in Technical Trading Systems, used a 14-period lookback for the whole directional movement system. The 25 trend threshold is a widely used interpretation; some traders use 20, 30, or higher, and each is a different strategy.
Is an ADX strategy profitable?
There is no general answer, and no honest one promises profit. Whether any ADX rule has an edge depends on the instrument, the market regime, the costs, and crucially whether it survives out-of-sample and walk-forward testing. Past backtested behaviour does not guarantee future results.
Why does an ADX strategy whipsaw?
Because ADX is a lagging measure, the line rises only after a trend has begun, so signals can arrive late and reverse if the trend stalls. In range-bound markets the directional lines cross repeatedly while ADX stays low, which is why regime testing across trending and ranging data matters.
Can I build an ADX strategy without coding?
Yes. No-code platforms let you express the indicator, entry, exit, and risk rules visually, then backtest and validate them. The effort shifts from writing software to judging whether the strategy genuinely holds up.
The breakout a trader spots on a single Nifty chart is worth taking seriously, and worth distrusting in equal measure, until it has been tested. That gap between a promising idea and a strategy that has earned live capital is the layer daZh by Zudora is built around: a no-code platform where an ADX rule, or any indicator rule, is built visually, backtested with realistic assumptions, then validated through parameter optimisation, walk-forward analysis, overfitting detection, and Monte Carlo robustness before any money is committed. The indicator gives you the hypothesis. The validation tells you whether it deserves to be tried.
Related guides
- Supertrend trading strategy: build, backtest, and validate
- Moving average crossover strategy
- RSI trading strategy and best indicators for intraday trading
- What walk-forward analysis is, out-of-sample testing, and overfitting
- Pillar: A framework for systematic trading
Disclaimer: daZh is a software platform for building, testing, and managing user-defined trading strategies. It does not provide investment advice, stock recommendations, guaranteed returns, or profit assurance. Backtests are based on historical data and assumptions; actual trading results may differ.
Sources
- J. Welles Wilder Jr., "New Concepts in Technical Trading Systems", Trend Research, 1978 (the originating source for the directional movement system, ADX, +DI and -DI; default 14-period setting), as documented in StockCharts ChartSchool, "Average Directional Index (ADX)". https://chartschool.stockcharts.com/table-of-contents/technical-indicators-and-overlays/technical-indicators/average-directional-index-adx
- David H. Bailey, Jonathan M. Borwein, Marcos López de Prado, Qiji Jim Zhu, "Pseudo-Mathematics and Financial Charlatanism: The Effects of Backtest Overfitting on Out-of-Sample Performance", Notices of the American Mathematical Society, 61(5), May 2014. https://papers.ssrn.com/sol3/papers.cfm?abstract_id=2308659
- CFA Institute, "Backtesting and Simulation", CFA Program refresher reading, 2026 curriculum. https://www.cfainstitute.org/insights/professional-learning/refresher-readings/2026/backtesting-and-simulation