
An investment that grew from ₹1 lakh to ₹2 lakh over five years did not grow by 20% a year, even though the total gain was 100% and 100 divided by five is 20. The honest yearly figure is closer to 14.9%. Each year's growth builds on the year before it, so a simple average of yearly returns overstates what an investment actually earned. CAGR, the compound annual growth rate, is the number that gets this right: the single steady rate that would have carried the starting value to the ending value over the period, if it had grown by the same amount every year.
Definition
"CAGR is the constant annual rate at which a value would have to grow, compounding each year, to move from its starting amount to its ending amount over a given number of years."
That phrase, compounding each year, is the whole point. Growth in one year is earned on top of the growth already banked in earlier years, so the rate that connects a start to an end is not the simple average of the yearly changes. It is the geometric mean of the annual growth factors, a different kind of average that respects compounding. The CFA Institute's curriculum treats this geometric mean as the standard measure of compound growth across multiple periods, precisely because a simple average answers the wrong question once money starts compounding on itself.
Each year's growth builds on the year before it, so a simple average of yearly returns overstates what an investment actually earned.What CAGR actually measures
CAGR describes one thing cleanly and ignores everything else. It takes where a value started, where it ended, and how long that took, and returns the smooth yearly rate that ties the two endpoints together. It says nothing about what happened in between. A figure that doubled over five years has the same CAGR whether it climbed in a calm straight line or lurched through a brutal fall before recovering.
That is the property to hold onto: CAGR reads only the start and the end, and everything that happened in between is invisible to it.
CAGR reads only the start and the end, and everything that happened in between is invisible to it.Figure 1 makes the point with two paths that start at ₹1 lakh and end at ₹2 lakh over the same five years. They share an identical CAGR of 14.9%, yet one rises steadily while the other plunges below its starting value before clawing back. The single annual rate cannot tell them apart.
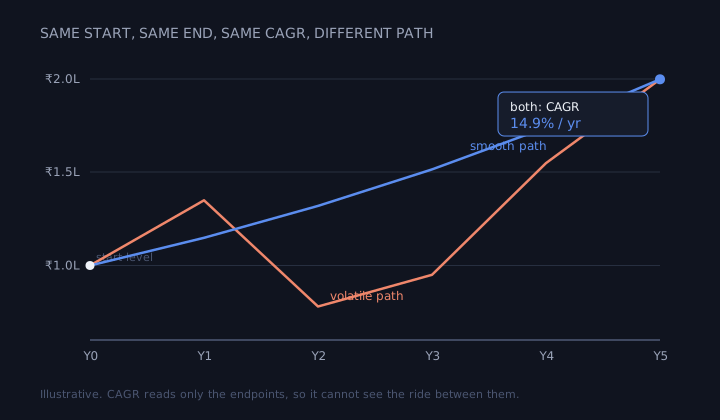
Figure 1: Same start, same end, same CAGR. The smooth path and the volatile path share an identical compound annual growth rate, because CAGR reads only the endpoints. Illustrative figures, not a real strategy or a recommendation.
This is why CAGR is so widely used and so easy to lean on too hard. It is the natural way to compare growth across investments measured over different lengths of time, which is why the market regulator anchors fund performance to it. SEBI requires that for a mutual fund scheme in existence for more than one year, only the compounded annualised yield can be advertised, shown for the last one, three, and five years and since the scheme's launch. The rule exists so that a three-year record and a seven-year record can be read on the same scale. A single annualised number standardises the comparison.
How CAGR is calculated
The formula follows straight from the definition. Divide the ending value by the starting value to get the total growth multiple, raise it to the power of one over the number of years to undo the compounding, and subtract one to turn the multiple back into a rate.
CAGR = (Ending Value / Starting Value) ^ (1 / Number of Years) − 1

Ending Value = the value at the end of the period
Starting Value = the value at the start of the period
Number of Years = the length of the period, in years

Equivalently, CAGR = the geometric mean of the annual
growth factors, minus 1
CAGR is cleanest when the value grows from one starting amount to one ending amount without outside cash flows. If money was added or withdrawn during the period, the CAGR of the account value can be misleading; a time-weighted return or a money-weighted return, such as XIRR, is usually needed instead.
Take the opening example. A value moving from ₹1,00,000 to ₹2,00,000 over five years has a growth multiple of 2. The fifth root of 2 is about 1.1487, so the CAGR is roughly 14.87%, not the 20% a careless division would suggest. The table below lays out the inputs.
| Input | Value |
|---|---|
| Starting value | ₹1,00,000 |
| Ending value | ₹2,00,000 |
| Number of years | 5 |
| Total growth | 100% |
| CAGR | 14.87% |
Illustrative figures.
Figure 2 plots that single rate as a growth curve. Starting at ₹1 lakh and compounding at 14.87% a year, the line passes through roughly ₹1.15 lakh, ₹1.32 lakh, ₹1.52 lakh, and ₹1.74 lakh before reaching ₹2 lakh at the end of year five. The curve bends upward as it climbs, which is the visible signature of compounding: the same percentage applied each year adds more rupees as the base grows.
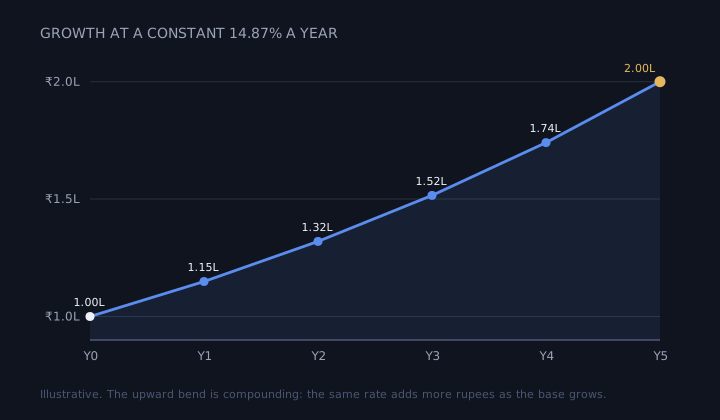
Figure 2: The same CAGR drawn as a growth curve. A constant 14.87% a year carries ₹1 lakh to ₹2 lakh over five years, and the upward bend is the effect of compounding. Illustrative figures.
Why it differs from a simple average
The reason CAGR is not the average of yearly returns sits in the arithmetic of gains and losses. A loss is taken on a larger base and recovered on a smaller one, so a drop and an equal-sized rise do not cancel. A value that rises 50% and then falls 50% does not return to where it started: ₹1,00,000 becomes ₹1,50,000 and then ₹75,000. The arithmetic average of plus 50 and minus 50 is zero, yet the money shrank by a quarter. The CAGR, which looks at the real endpoints, reports the loss the average pretends away.
The same gap shows up, smaller but still real, in any uneven return stream. Consider five years of returns on a starting ₹1 lakh.
| Year | Annual return | Value at year end |
|---|---|---|
| 1 | +20% | ₹1,20,000 |
| 2 | −10% | ₹1,08,000 |
| 3 | +30% | ₹1,40,400 |
| 4 | −5% | ₹1,33,380 |
| 5 | +15% | ₹1,53,387 |
Illustrative figures.
The arithmetic mean of those five returns is 10.0%, found by adding them and dividing by five. The CAGR, which respects how each year compounds on the last, is about 8.93%, the fifth root of the final multiple of 1.534. The arithmetic average overstates the true compounded growth by roughly 1.1 percentage points, and that overstatement is not an error in either number. It is structural. The geometric mean of a set of returns is always at or below their arithmetic mean, and the two are equal only when every return is identical. Burt Rodin, in a 2015 paper, formalised this as a sharp inequality and showed that the gap between the arithmetic and geometric means is governed by the variance of the values, the statistical measure of how much the returns scatter around their average.
The gap between the two is not noise. It is the cost of volatility itself.Figure 3 puts the two numbers side by side. The gap between the two is not noise. It is the cost of volatility itself. The more a return stream swings, the further its compounded result falls below the simple average of its yearly numbers. A common rule of thumb expresses it as the geometric mean sitting roughly one half of the variance below the arithmetic mean, which is why two strategies with the same average yearly return can compound at quite different rates if one is far jumpier than the other.
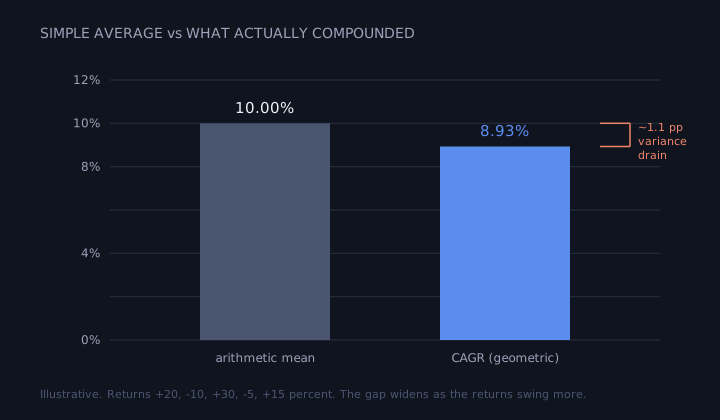
Figure 3: Arithmetic average versus CAGR for the same five returns. The arithmetic mean reads 10%, but the value actually compounded at 8.93%, and the gap is driven by the volatility of the returns. Illustrative figures.
How to read it, and what it hides
Read as what it is, CAGR is an honest summary of compound growth and a fair way to line up records of different lengths. Read as more than that, it quietly drops the two things a trader most needs to know: how rough the ride was, and whether the record is anything like the future.
| CAGR tells you | CAGR does not tell you |
|---|---|
| How fast the endpoint grew each year | How painful the path was |
| The compounded annual rate | The worst drawdown |
| A clean comparison across windows | Whether the window was cherry-picked |
| Past realised growth | Future expected growth |
| Endpoint-to-endpoint performance | Risk-adjusted performance |
The first omission is the path. Because CAGR depends only on the endpoints, it carries no information about the worst fall along the way. The two curves in Figure 1 prove it: identical CAGR, wildly different experiences. A strategy can post an attractive compound rate and still have passed through a drawdown deep enough that few traders would have held on to collect the recovery. CAGR is silent on that, which is why it is read next to drawdown and the Sharpe ratio, the measure of return earned per unit of risk, rather than on its own. A single annual rate is a convenience, not the whole truth, and the path it smooths over is where the risk lived.
A single annual rate is a convenience, not the whole truth, and the path it smooths over is where the risk lived.The second omission is time. CAGR is a backward-looking statistic. It describes what happened between two dates under one set of conditions, and it makes no promise that the same rate continues. A figure built from a stretch of history that happened to be calm and rising will look very different from one measured across a full cycle that included a crash.
Limits and pitfalls
A few traps recur often enough to name. The most common is the choice of endpoints. Because CAGR depends entirely on the start and end values, moving either date can transform the number. Begin the measurement at a market bottom and end it at a peak and the CAGR flatters; begin at a peak and the same investment looks poor. A single annual figure says nothing about whether its window was representative or hand-picked, so the period it covers matters as much as the number itself.
A second trap is treating CAGR as a forecast. It is a description of realised growth, not a projection, and presenting a past compound rate as the rate to expect is exactly the kind of claim that backtests tempt traders into making. The third is comparing CAGRs computed over different windows as if they were equivalent: a CAGR over three years and one over ten are answering questions about different stretches of history, and the longer record has simply survived more of what markets do.
For a strategy, the deeper limit is the one Figure 1 illustrates. Two systems can compound at the same rate while one of them would have been impossible to hold. CAGR ranks growth; it does not grade risk. That job belongs to the metrics it sits beside.
A checklist before you trust CAGR
Before reading a compound annual growth rate as the headline number, ask:
- What were the exact start and end dates, and was the window hand-picked or representative?
- Does the period cover a full market cycle, including at least one serious decline?
- Is this CAGR being compared with another measured over the same length of time?
- What was the worst drawdown along the way, and could you have held through it?
- Does the Sharpe or Sortino ratio agree that the growth was earned efficiently?
- Is the number being read as a description of the past, not a forecast of the future?
- For an uneven return stream, is this the geometric CAGR and not a simple average of yearly returns?
A trading idea earns its CAGR only inside a test, and the test is where the endpoints, the window, and the path either hold up or quietly flatter the result. Computing the rate honestly, over a full cycle, and then reading it next to drawdown and risk-adjusted return rather than alone, is part of putting validation between a trading idea and live capital. That is the layer daZh by Zudora is built to be: a place to test an idea against history, see the compound growth it produced, and inspect the drawdown and risk metrics underneath that single smooth number before any money is at stake. A backtest cannot promise the next year's growth. It can show you the rate the past actually compounded at, and the ride that produced it, while learning both is still cheap.
Frequently asked questions
What is CAGR?
CAGR, the compound annual growth rate, is the constant yearly rate that would carry a starting value to an ending value over a period. It is the geometric mean of the annual growth factors, not a simple average of the yearly returns.
How do you calculate CAGR?
Divide the ending value by the starting value, raise the result to the power of one over the number of years, and subtract one. A value moving from ₹1,00,000 to ₹2,00,000 over five years gives a CAGR of about 14.87%.
What is the difference between CAGR and average return?
The arithmetic average adds the yearly returns and divides by their count, while CAGR compounds them. Because of compounding, CAGR sits at or below the arithmetic average, and the gap widens as the returns swing more.
Why is CAGR lower than the simple average of returns?
A loss is taken on a larger base and recovered on a smaller one, so equal up and down moves do not cancel. The geometric mean is always at or below the arithmetic mean, and the two are equal only when every return is identical.
What is a good CAGR?
There is no universal threshold. A CAGR is only meaningful read against its time window, the risk taken to earn it, and a relevant benchmark, since a higher rate built on a deeper drawdown is not obviously better.
Does CAGR show risk?
No. CAGR reads only the start and end values, so it hides the path and the worst fall along the way, which is why it is read alongside drawdown and the Sharpe ratio rather than on its own.
Related concepts
- Drawdown, the companion risk metric that captures the worst fall CAGR hides.
- Sharpe ratio, the measure of return earned per unit of risk that CAGR should be read beside.
- Sortino ratio, which refines the view of risk by counting only downside volatility.
- A Framework for Systematic Trading.
Disclaimer: daZh is a software platform for building, testing, and managing user-defined trading strategies. It does not provide investment advice, stock recommendations, guaranteed returns, or profit assurance. Backtests are based on historical data and assumptions; actual trading results may differ.
Sources
- CFA Institute, "Rates and Returns", CFA Program refresher reading, 2026 curriculum. https://www.cfainstitute.org/insights/professional-learning/refresher-readings/2026/rates-and-returns
- SEBI, circular on mutual fund advertisements requiring compounded annualised yield for schemes in existence over one year. https://www.sebi.gov.in/sebi_data/commondocs/cirmf42000_h.html
- Burt Rodin, "Variance and the Inequality of Arithmetic and Geometric Means", arXiv:1409.0162, 2015. https://arxiv.org/abs/1409.0162