
Two strategies each returned 18% over the year, and a standard volatility figure says they were equally risky. Look closer and the story splits: one strategy got there with a few sharp gains and otherwise stayed calm, while the other ground out the same return through a steady drip of small losses punctuated by recoveries. A trader would feel those two very differently, yet the Sharpe ratio, which divides return by total volatility, scores them the same, because standard deviation treats a happy surprise and a painful one as identical. The Sortino ratio exists to fix exactly that blind spot. It measures the return a strategy earned per unit of downside risk only, the volatility that fell below a target the trader cares about.
Definition
"The Sortino ratio is a strategy's return above a target, the minimum acceptable return, divided by its downside deviation, the volatility of only the returns that fall below that target."
The measure is named after Dr. Frank Sortino of the Pension Research Institute, and the idea it builds on is older still. Harry Markowitz recognised the distinction back in 1959 when he proposed a measure of downside variability he called semivariance, but the calculation was too complex without computers, so he focused on mean variance instead, and standard deviation became the predominant measure of risk ever since, as the CFA Institute recounts in its review of the metric. Sortino and Lee Price gave the modern ratio its shape in a 1994 paper for the Journal of Investing, "Performance Measurement in a Downside Risk Framework", where they argued that a goal-oriented performance measure should be built around the return an investor actually needs, not the risk-free rate.
It measures the return a strategy earned per unit of downside risk only, the volatility that fell below a target the trader cares about.What the Sortino ratio measures
The starting point is a simple observation about how risk feels. Behavioural finance tells us that large negative surprises do not produce the same emotions as large positive ones, so defining risk by measuring only the "bad" volatility of a distribution is intuitively appealing. Standard deviation, the measure inside the Sharpe ratio, does the opposite. It assumes a symmetric return distribution and penalises upside and downside deviations equally, and it uses the average return as its reference point. For a strategy whose returns lean lopsided, frequent small gains and rare large drops, or the reverse, that even-handedness hides the thing a trader most wants to know.
The Sortino ratio narrows the lens to one side. It was created in recognition that large positive performance deviations should not be penalised in the same way as large negative ones, and that failing to earn the average return is not how most investors define risk. Instead of charging a strategy for every wobble, it charges it only for the wobbles that landed below a target, then asks how much return the strategy earned for taking that specific risk.
Figure 1 shows the core idea on a year of monthly returns. A horizontal line marks the target return. Every month that finished above the line is left out of the risk calculation entirely, however far above it landed, because an upside surprise is not the risk a trader is trying to avoid. Only the months that fell below the target, shaded in coral, feed the downside deviation. The picture is the whole concept. Good volatility is free, and only the shortfall below your target is counted against you.
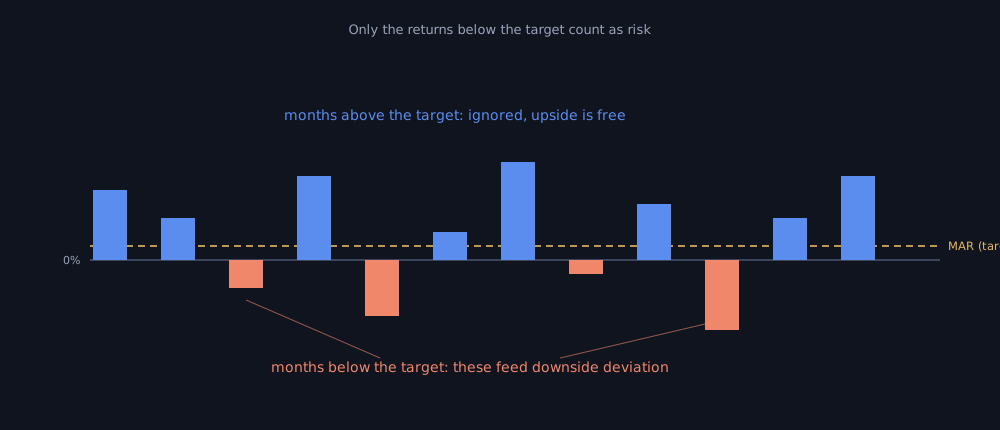
Figure 1: Only the returns that fall below the target count as risk. Upside months, however large, are excluded from downside deviation. Illustrative figures.
How the Sortino ratio is calculated
The Sortino ratio keeps the same shape as the Sharpe ratio and swaps two pieces. In the numerator, the risk-free rate is replaced by the minimum acceptable return, the target. In the denominator, standard deviation is replaced by downside deviation. The CFA Institute states the formula plainly: it is calculated in the same way as the Sharpe ratio except that the MAR replaces the risk-free rate in the numerator and downside deviation replaces standard deviation in the denominator.
Sortino Ratio = (Average Return − Minimum Acceptable Return) / Downside Deviation

Average Return = the strategy's mean return over the period
Minimum Acceptable Return (MAR) = the target return the trader sets
Downside Deviation = the spread, in the standard-deviation family,
                     of only the returns that fell below the MAR
Two terms carry the meaning. The minimum acceptable return, or MAR, is the target rate the trader sets, and it can be an absolute return, an index return, the risk-free rate, or simply zero, which expresses zero tolerance for losing principal. The downside deviation measures dispersion in the same family as standard deviation, except that it substitutes that investor-defined target for the mean and counts only the returns below it. One consequence is worth stating carefully. For a perfectly symmetric, normally distributed return stream, the upside and downside mirror each other, so the Sortino ratio adds little that the Sharpe ratio does not: the CFA review notes that an investment with normally distributed returns will have the same level of riskiness under both standard deviation and semideviation. The ratio earns its keep when returns are skewed, with gains and losses shaped differently.
Good volatility is free, and only the shortfall below your target is counted against you.A worked figure from the CFA Institute review makes the denominator concrete. Using the monthly returns of a large-cap equity index over the ten years from 2001 to 2010, with a monthly MAR of 0.4167%, which is 5% annually, the downside deviation works out to 3.71% per month. Annualising it by multiplying by the square root of twelve gives about 12.84%. That last step carries a warning the review flags more than once: annualising downside deviation the way you annualise standard deviation can overstate risk, because the figure is built from a smaller, hand-limited slice of the data.
The Sortino ratio is target-sensitive
Because the MAR sits inside the numerator and decides what counts as a shortfall, the target a trader picks changes the ratio. The same returns can score differently depending on what is treated as failure.
| MAR used | What it means |
|---|---|
| 0% | Counts only losing periods as downside |
| Risk-free rate | Measures return above a cash-like alternative |
| Required return | Measures failure to meet the trader's own hurdle |
| Benchmark return | Measures downside relative to an index or strategy benchmark |
The same strategy can have different Sortino ratios depending on the MAR. That is not a flaw, it is the point. The ratio only means something when the target reflects the return the trader actually needed.
Same Sharpe, different Sortino
The clearest way to see what the Sortino ratio adds is to hold the Sharpe ratio still and let it move. Consider two strategies that earned the same average return, set the same target, and even carried the same total volatility, so their Sharpe ratios are identical. The difference is where that volatility sat. Strategy A's swings were mostly to the upside, with only a modest part falling below the target. Strategy B reached the same place through far more downside churn.
| Metric | Strategy A | Strategy B |
|---|---|---|
| Average annual return | 18% | 18% |
| Target return (MAR) | 6% | 6% |
| Total volatility | 20% | 20% |
| Downside deviation | 10% | 16% |
| Sharpe-style ratio | 0.60 | 0.60 |
| Sortino ratio | 1.20 | 0.75 |
Illustrative figures, not a real strategy or a recommendation.
On the Sharpe ratio, the two strategies are indistinguishable: same return over the target, same total volatility, both score 0.60. The Sortino ratio pulls them apart. Because A kept most of its volatility above the line, its downside deviation is only 10%, lifting its Sortino ratio to 1.20. B's heavier downside drags its figure to 0.75. Figure 2 plots the split: the total-volatility bars are equal, but the downside-deviation bars are not, and that gap is the whole reason the two strategies should not be ranked the same.
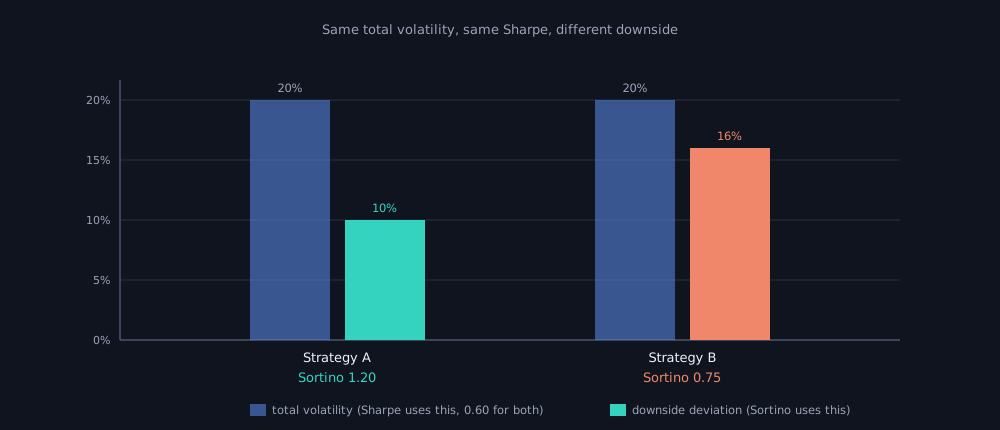
Figure 2: Two strategies with the same total volatility and the same Sharpe ratio. Their downside deviations differ, so their Sortino ratios differ. Illustrative figures.
How to read the number
A Sortino ratio is read in the same direction as a Sharpe ratio: higher is better, and it indicates more return earned per unit of the risk it measures. There is one habit worth unlearning, though. When the target is comparable to the risk-free rate, the Sortino ratio often comes out higher than the Sharpe ratio, because downside deviation is usually smaller than total standard deviation. But if the MAR is set higher, the numerator shrinks, so the Sortino is not automatically higher, and the familiar Sharpe thresholds do not carry over directly. A Sortino ratio of 1.5 is not the same achievement as a Sharpe of 1.5.
| Sortino ratio | Rough reading | What to check next |
|---|---|---|
| Below 0 | Returns fell short of the target on average | Reject, or investigate deeply |
| 0 to 1 | Modest reward for the downside risk taken | Drawdown, costs, consistency |
| 1 to 2 | Solid downside-adjusted return | Compare against similar strategies |
| Above 2 | Strong, and worth a second look | Inspect for smoothing or a short, calm window |
Illustrative figures.
Those bands are a loose convention, not a law, and Figure 3 lays them out as a scale rather than hard gates. The same number means different things across market regimes and across the choice of MAR, which is why the figure is most honest as a relative tool. Two strategies tested the same way, over the same window, with the same target: the higher Sortino ratio earned its return with less painful volatility underneath it. There is also a tidy edge case worth knowing. If the MAR is set equal to the risk-free rate and the returns happen to be normally distributed, the Sortino ratio assigns the same ranking as the Sharpe ratio, because the two denominators converge.
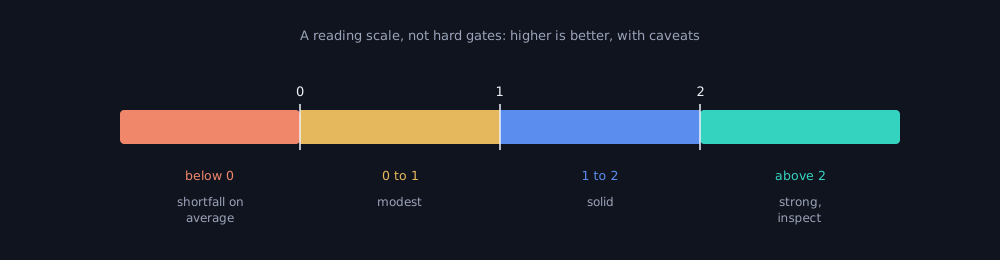
Figure 3: The reading bands as a scale, not hard gates. Where a Sortino ratio sits is a prompt to investigate, not a final grade. Illustrative figures.
A Sortino ratio of 1.5 is not the same achievement as a Sharpe of 1.5.Where the Sortino ratio misleads
The Sortino ratio fixes one weakness of the Sharpe ratio and inherits a few problems of its own. The first lives in the denominator. Downside deviation is built from only the returns that fell below the target, which is a smaller sample than the full return series, and a smaller sample is noisier and easier to distort. As one practitioner quoted in the CFA Institute review puts it, while the statistic, downside deviation, is easy to understand it is also easy to miscalculate. A common error is to divide the sum of squared shortfalls by the number of below-target observations rather than the total number of observations, which inflates the figure and depresses the ratio.
The window and the frequency matter as much as they do for any risk-adjusted measure. Performance results depend heavily on the period under consideration, and excluding upside deviations further limits the sample the calculation draws on. The CFA review illustrates the danger with the equity market that posted ten straight years of positive annual returns through the 1980s, only to plunge the year after the sample ended: a downside figure built on that calm decade would have badly understated the real risk. The same hazard sits behind serial correlation, where smoothed or stale prices make returns look less variable than they were. Andrew Lo's 2002 work in the Financial Analysts Journal documented how that effect can overstate the Sharpe ratios of funds holding illiquid, infrequently priced positions by as much as 65%, and the same smoothing inflates downside-based measures too.
The deepest limit is conceptual. By design, the Sortino ratio looks only at downside, so it can quietly reward a strategy whose upside was generated by the very risk-taking that could later produce matching losses. The CFA review is blunt that the ratio is a useful tool but not a complete measure of risk, and it closes with a line from Sortino himself that belongs on every dashboard. Just because nothing bad happened doesn't mean you didn't take any risk. The ratio also says nothing about the depth of the single worst stretch a trader would have had to sit through, which is the job of a maximum drawdown figure, and little about how the Sharpe ratio would have judged the same returns. Read together, the three tell a fuller story than any one of them alone.
Just because nothing bad happened doesn't mean you didn't take any risk.A checklist before you trust a Sortino ratio
Before trusting a Sortino ratio, ask:
- What target return, the MAR, was used, and does it match the goal you actually care about?
- Was the downside deviation divided by the total number of observations, not just the below-target ones?
- Was it annualised honestly, given that annualising downside deviation can overstate risk?
- Is the figure built on enough below-target observations to be stable, or on a handful?
- Were the returns liquid and marked honestly, with no smoothing or serial correlation?
- Is it measured over a full market cycle that included a real downturn?
- Does the drawdown tell the same story about the worst stretch?
- Does the Sharpe ratio confirm or contradict it?
A trading idea only earns its Sortino ratio inside a test, and a test is where these assumptions either hold or fail without saying so. Computing the ratio honestly, over a full cycle, on realistic returns, then reading it next to drawdown and the Sharpe ratio rather than alone, is part of putting validation between an idea and live capital. That is the layer daZh by Zudora is built to be: a place to test a strategy against history, set a target that reflects your own goal, compare Sortino with Sharpe and drawdown, and inspect whether downside-adjusted performance survives before any money is at stake. A metric cannot promise the next trade. Reading the Sortino ratio well means asking what produced the number, and what it leaves out, before trusting it.
Frequently asked questions
What is the Sortino ratio?
It measures the return a strategy earned above a target return per unit of downside risk, dividing the return above the minimum acceptable return by the downside deviation. Only the volatility that fell below the target counts as risk, so upside swings are left out.
What is the difference between the Sortino ratio and the Sharpe ratio?
The Sharpe ratio divides excess return by total volatility, treating upside and downside swings as equal risk, while the Sortino ratio divides return above a target by downside deviation, counting only below-target moves. The Sortino ratio suits returns that are skewed rather than symmetric.
What is a good Sortino ratio?
There is no universal cutoff, but as a loose convention a reading of 1 to 2 is often treated as solid and above 2 as strong, though those bands shift with the market window and the chosen target. Because downside deviation is smaller than total volatility, Sortino thresholds sit higher than the equivalent Sharpe thresholds.
How is the Sortino ratio calculated?
It keeps the shape of the Sharpe ratio with two swaps: the minimum acceptable return replaces the risk-free rate in the numerator, and downside deviation replaces standard deviation in the denominator. So it is the return above the target divided by the downside deviation.
What is downside deviation?
It measures dispersion in the same family as standard deviation, except it substitutes the trader's target return for the mean and counts only the returns that fell below that target. It is easy to miscalculate, for example by dividing the squared shortfalls by the count of below-target observations rather than the total number of observations.
Why is the Sortino ratio usually higher than the Sharpe ratio?
When the target return is close to the risk-free rate, the Sortino ratio often comes out higher because downside deviation is usually smaller than total standard deviation. If the MAR is set higher, the numerator can shrink, so Sortino is not automatically higher than Sharpe.
Related concepts
- Sharpe ratio, the parent measure the Sortino ratio refines by counting only downside volatility.
- Drawdown, the companion risk metric that captures the worst peak-to-trough fall.
- Strategy validation, the process where risk-adjusted metrics like this one are read.
- A framework for systematic trading, the broader decision process this metric sits inside.
Disclaimer: daZh is a software platform for building, testing, and managing user-defined trading strategies. It does not provide investment advice, stock recommendations, guaranteed returns, or profit assurance. Backtests are based on historical data and assumptions; actual trading results may differ.
Sources
- Frank A. Sortino and Lee N. Price, "Performance Measurement in a Downside Risk Framework", The Journal of Investing, Fall 1994, 3(3): 59 to 64. DOI: 10.3905/joi.3.3.59. https://joi.pm-research.com/content/3/3/59
- Deborah Kidd, "The Sortino Ratio: Is Downside Risk the Only Risk that Matters?", CFA Institute, Investment Performance Measurement, 2012. https://rpc.cfainstitute.org/sites/default/files/-/media/documents/code/gips/the-sortino-ratio.pdf
- Andrew W. Lo, "The Statistics of Sharpe Ratios", Financial Analysts Journal, 2002, 58(4): 36 to 52. https://rpc.cfainstitute.org/research/financial-analysts-journal/2002/the-statistics-of-sharpe-ratios