On a daily chart, the moment looks unmistakable. The shorter average lifts up through the longer one, the two lines form a clean X, and a label flashes across the feeds: golden cross. The pattern has a name, a reputation, and decades of being treated as a buy signal. What it does not arrive with is any proof that trading it would have made money, net of costs, on the instrument you actually trade.
That gap is what this guide works through. A moving average crossover strategy is one of the oldest and most teachable rules in technical analysis, which makes it a good place to learn a discipline that matters more than the rule itself: how to take an indicator idea, build it as a precise rule set, backtest it honestly, and then validate it hard enough to learn whether the edge is real or imagined.
The order is the point. Build, then backtest, then validate. Skip the last step and a single flattering backtest is all it takes to fund a rule that history never actually supported. The building takes minutes. The validation is where most crossover rules quietly fail. Finding that out on a screen is far cheaper than finding it out in the market.
The building takes minutes. The validation is where most crossover rules quietly fail.What a moving average crossover is
A moving average crossover compares two averages of price that move at different speeds. A simple moving average, or SMA, is, in Fidelity's description, "calculated by adding all the data for a specific time period and dividing the total by the number of days." Recomputed each day, it slides forward and smooths the jagged price line into a single trend reading.
The crossover uses two of them, each smoothing price over a different number of days. The shorter average is the fast one, more reactive to recent prices; the longer is the slow one, more lethargic. When the fast line crosses above the slow line, momentum has turned up relative to the longer trend; when it crosses below, the reverse.
Those two events have names. The golden cross is when the 50-day average crosses above the 200-day, read as a bullish signal. The death cross is the mirror image, the 50-day crossing below the 200-day, read as bearish. The Corporate Finance Institute frames the 50-day and 200-day pairing as the standard, while noting "some market analysts favor using other moving averages."
The method is old. Richard Donchian, the trader often called the father of trend following, built one of the first trend-following systems based on two different moving averages back in the early thirties. One trait has held ever since: the crossover is a lagging signal. As the Corporate Finance Institute puts it, the cross "is often a very lagging indicator," confirming a move that has already begun rather than predicting one about to start. Figure 1 shows the rule on a price series.
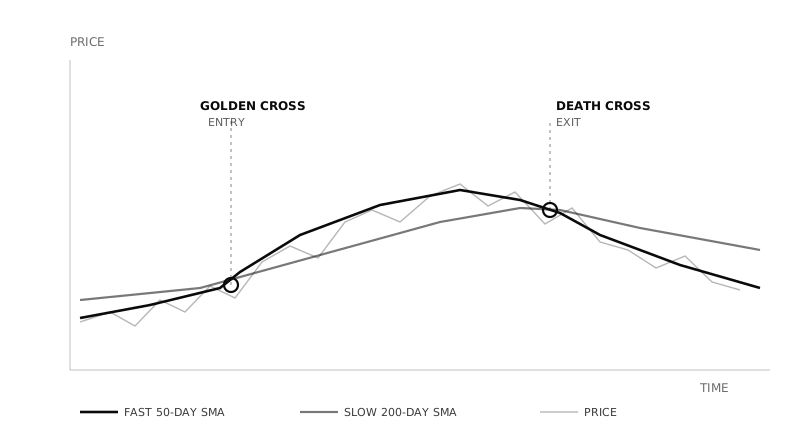
Figure 1: A moving average crossover. The fast 50-day average crossing above the slow 200-day average marks the golden cross entry; crossing back below marks the death cross exit. The raw price wanders, the averages smooth it. Illustrative figures.
How to build it as a no-code rule set
A crossover becomes testable only when every word is turned into an exact rule. "Buy the golden cross" is a sentence; a backtest needs a condition. The standard long-only version reads as two rules to test, not advice to follow: enter long when the fast SMA closes above the slow SMA, and exit when the fast SMA closes back below it. A trend-following variant flips short on the death cross instead of moving to cash.
Even that needs the small print filled in. Which price, the close or the intraday touch? Most builds require the cross to hold on the closing price, so an intraday spike that reverses does not trigger a trade. How large is each position, and is shorting allowed or does the rule simply stand aside? Those choices change the result as much as the periods do, which is why they are part of the hypothesis, not a footnote to it.
The periods themselves are the most-argued setting, and there is no universally correct pair. The 50-day and 200-day daily combination is the famous one. Faster pairs react sooner and trade more often; slower pairs filter noise but enter later. The table below lists common configurations purely as starting points to test on your own instrument and timeframe.
| Configuration | Fast / slow | Typical use | Trade-off to test |
|---|---|---|---|
| Golden / death cross | 50 / 200, daily | Long-term trend | Few trades, very late signals |
| Short-term cross | 5 / 20, daily | Reactive trend trades | More reactive, more whipsaws |
| EMA momentum | 9 / 21, exponential | Faster trend turns | Quicker but noisier |
| Medium swing | 20 / 50, daily | Swing positions | Middle ground |
| Weekly cross | 50 / 200, weekly | Slow, high-conviction | Fewest signals, fewest false ones |
Illustrative configurations, not recommendations.
None of these is "the best." They are five different bets about how much lag to trade for how much noise. Only a backtest can tell you how each behaved on the market you care about.
They are five different bets about how much lag to trade for how much noise.How to backtest it
A backtest replays the finished rule across historical data and reports what it would have done. The trap is reading only the headline return. A crossover rule can post a healthy total return and still be unrunnable, because the same history hides how it got there.
The numbers that decide whether a rule is survivable are the uncomfortable ones. Maximum drawdown, the largest peak-to-trough fall in the account, tells you the worst stretch you would have had to sit through. The Sharpe ratio measures return per unit of risk. Win rate and expectancy, the average outcome per trade, separate a rule that wins often and small from one that wins rarely and large. The trade count matters too: a 50/200 daily cross might trade a handful of times in a decade, while a 5/20 intraday version trades constantly.
Costs are not optional in that calculation. Every real trade pays brokerage, statutory charges, and slippage, the gap between the price you wanted and the price you got. A crossover that trades rarely is barely touched by them; a fast intraday variant can hand its entire paper edge back to costs without the gross curve ever hinting at trouble. A backtest that does not charge the rule for trading is measuring an edge no one could capture.
A backtest that does not charge the rule for trading is measuring an edge no one could capture.The backtest's most useful service is exposing the crossover's structural weakness. In a trending market the rule gets in and rides; in a sideways market it is whipsawed, crossing up and down repeatedly and bleeding small losses each time. Figure 2 sketches that pattern: ground gained in trends, given back through the chop.
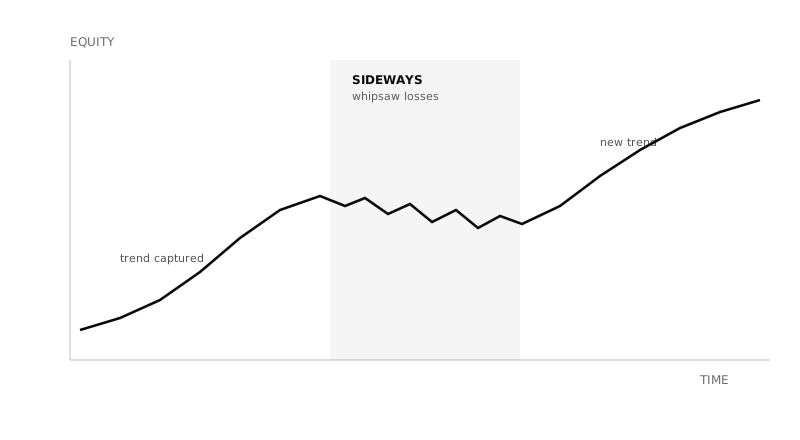
Figure 2: A crossover equity curve, schematically. The rule captures trends and bleeds through sideways stretches where it is whipsawed in and out. A backtest that only shows the endpoints hides the middle. Illustrative figures.
How to validate it
A clean backtest is a starting point, not proof. This is the step that separates a rule worth running from one that only looked good, and it is the step most often skipped. The reason is uncomfortable: tune enough period pairs against the same stretch of history and one of them will fit that history's noise, a trap called overfitting. Bailey, Borwein, López de Prado, and Zhu showed in "Pseudo-Mathematics and Financial Charlatanism" that the more configurations you try, the likelier the best-looking one is simply luck.
Validation is the set of tests built to catch that. The first is out-of-sample testing: reserve a slice of history the tuning never touches, choose the periods on the rest, and judge the rule only on the slice it has never seen. The second is walk-forward analysis, which rolls that tune-then-test window forward across the whole history, so the rule has to keep working through changing conditions rather than one lucky stretch. Figure 3 shows the shape.
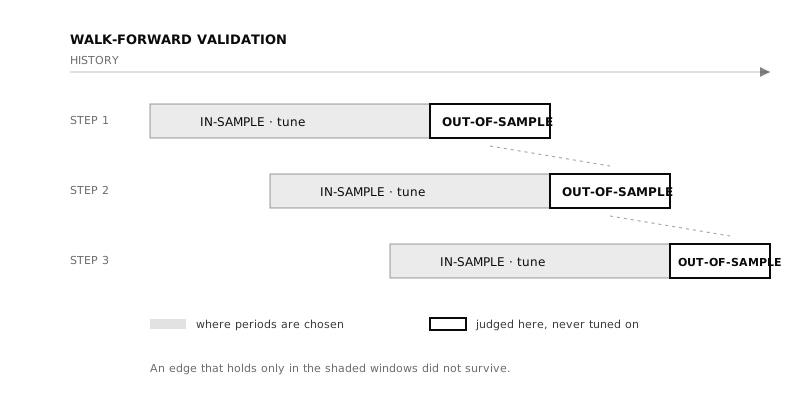
Figure 3: Walk-forward validation. The periods are tuned on each shaded in-sample window, then judged only on the out-of-sample window that follows, with the pair rolling forward each step. An edge that holds only in the shaded windows did not survive. Illustrative figures.
A third test, Monte Carlo simulation, resamples the order of the trades thousands of times to show how much of the result depended on a lucky sequence rather than a durable signal. Together these turn a single backtest into strategy validation. The CFA Institute frames the whole exercise as estimating "how would this strategy have performed if it were implemented in the past", with the honesty of the estimate resting on these guards. One good backtest answers the question once. Validation asks it repeatedly, on data the rule was never allowed to see. That is the only version of the answer worth trusting.
One good backtest answers the question once. Validation asks it repeatedly, on data the rule was never allowed to see.Limits and pitfalls
The crossover's weaknesses are well documented and worth stating plainly. It is a lagging rule by construction, so it enters after a trend has started and exits after it has ended, surrendering the turns at both ends. In range-bound markets it whipsaws, generating a run of false signals that each cost a little. Fidelity is blunt about this: a golden or death cross "does not suggest that you should mechanically buy or sell," because the signal can fire when you would rather not act.
Regime dependence is the deeper trap. The crossover earns its keep in trends and bleeds in ranges, so a backtest run over a period that happened to trend will flatter it, and the same rule may struggle when the market goes sideways. Parameter overfitting compounds the problem: nudging 50/200 to 47/211 because it backtested a shade better is usually fitting noise, not finding an edge. And costs scale with activity, so the faster the variant, the more of its paper return the rule pays away in charges and slippage. None of these makes the crossover useless. They make validation the difference between a rule you understand and one you only hope works.
A checklist before you trust a moving average crossover strategy
Before a crossover earns live capital, walk it through the same questions that separate a tested rule from a flattering chart.
| Checklist question | Why it matters |
|---|---|
| Did I define entry and exit rules before testing? | Prevents discretionary hindsight |
| Are brokerage, charges, and slippage included? | Prevents fantasy returns |
| Were the indicator's settings and thresholds chosen before testing? | Reduces curve-fitting |
| Did the rule survive out-of-sample data? | Tests whether it generalises |
| Did walk-forward results stay stable? | Tests parameter robustness |
| Did Monte Carlo show survivable drawdowns? | Tests sequence risk |
| Did I check how the rule behaved in range-bound stretches, not just trending ones? | A crossover lags and whipsaws in sideways markets, so a trend-heavy sample hides its worst behaviour |
Frequently asked questions
What is a moving average crossover strategy?
A trend-following rule that uses two moving averages of different lengths. It enters when the faster average crosses above the slower one and exits, or reverses, when the faster crosses back below. The classic version uses the 50-day and 200-day simple moving averages.
What are the golden cross and the death cross?
The golden cross is when the 50-day moving average crosses above the 200-day, read as bullish. The death cross is the opposite, the 50-day crossing below the 200-day, read as bearish. Both are lagging signals that confirm a move already underway rather than predicting one.
What are the best moving average periods to use?
There is no universally best pair. The 50/200 daily combination is the most cited, with faster pairs such as 5/20, 9/21, or 20/50 reacting sooner at the cost of more false signals. The right periods are the ones that survive out-of-sample and walk-forward testing on your instrument, not the ones that backtested best on a single stretch.
Does the moving average crossover strategy work?
It is a lagging trend-following rule, so it tends to capture sustained trends and lose ground in sideways markets. Whether it has a tradable edge for a given market depends entirely on honest backtesting and validation, including realistic costs. Past performance does not guarantee future results, and no rule should be treated as assured.
How do you reduce false signals and whipsaws?
Common approaches to test include using slower periods or a higher timeframe, requiring the cross to hold on a closing basis, or adding a confirmation filter. Each reduces whipsaws at the cost of entering later, which is itself a trade-off to validate rather than assume.
Is a moving average crossover good for intraday trading?
Faster pairs can be applied to intraday charts, but they trade far more often, which raises exposure to costs and whipsaws. The same build-backtest-validate discipline applies, and the cost drag is larger, so honest fee modelling matters more for intraday variants.
The crossover endures because it is simple to see and simple to state. That same simplicity is why it is so easy to trust on sight and so rarely tested with the rigour it deserves. The discipline that makes it useful, building it precisely, backtesting it honestly, and validating it on data it never saw, is the same discipline that makes any indicator rule trustworthy. That validation layer between a trading idea and live capital is what daZh by Zudora is built around: a no-code platform for turning a rule like this into a tested hypothesis, with walk-forward and Monte Carlo validation, parameter optimisation, and analytics that lead with drawdown and risk rather than the headline return. A crossover is a hypothesis. daZh by Zudora is where you find out whether it survives being one.
Related guides
- EMA trading strategy
- MACD trading strategy
- Supertrend strategy
- Best indicators for intraday trading
- Walk-forward analysis and overfitting
- Pillar: A framework for systematic trading
Disclaimer: daZh is a software platform for building, testing, and managing user-defined trading strategies. It does not provide investment advice, stock recommendations, guaranteed returns, or profit assurance. Backtests are based on historical data and assumptions; actual trading results may differ.
Sources
- Fidelity, "Moving averages: How to use them and what they signal", Fidelity Viewpoints (simple moving average calculation, the crossover method, golden and death cross). https://www.fidelity.com/viewpoints/active-investor/moving-averages
- Corporate Finance Institute, "Death Cross" (golden cross and death cross definitions, 50-day and 200-day standard, lagging-indicator caveat). https://corporatefinanceinstitute.com/resources/career-map/sell-side/capital-markets/death-cross/
- StockCharts ChartSchool, "Donchian Trading Guidelines" (Richard Donchian as an originator of two-moving-average trend-following systems). https://chartschool.stockcharts.com/table-of-contents/overview/donchian-trading-guidelines
- CFA Institute, "Backtesting and Simulation", CFA Program refresher reading, 2026 curriculum. https://www.cfainstitute.org/insights/professional-learning/refresher-readings/2026/backtesting-and-simulation
- David H. Bailey, Jonathan M. Borwein, Marcos López de Prado, Qiji Jim Zhu, "Pseudo-Mathematics and Financial Charlatanism: The Effects of Backtest Overfitting on Out-of-Sample Performance", Notices of the American Mathematical Society, 61(5), May 2014. https://papers.ssrn.com/sol3/papers.cfm?abstract_id=2308659