
Most quants spend their careers refining signals and tuning parameters. Almost none spend the same effort on a more fundamental question: what economic activity is the strategy actually engaged in, and why should that activity generate returns at all? Without an answer, you cannot tell structural edge from a regime that is about to end.
Systematic trading is usually described through its surface artifacts: signals, models, and performance statistics. Far less attention goes to the layer underneath, where the economic logic and statistical architecture decide how and why returns are generated in the first place. A taxonomy of strategy types is not a labeling exercise. It is a discipline for thinking, a way of evaluating risk, understanding capacity, and interpreting performance across market regimes that look nothing like one another.
Quantitative trading spans a wide spectrum of approaches, from trend-following and mean reversion to statistical arbitrage and factor investing. While these categories are often treated as distinct, their boundaries are porous and their underlying mechanics frequently overlap. Without a coherent classification framework, it becomes difficult to separate structural edge from incidental exposure.
A rigorous understanding of strategy taxonomy is therefore foundational. Before debating parameter selection or model sophistication, one must first clarify the economic activity being undertaken and the statistical assumptions embedded in the approach.
Fundamental Economic Activities and the Source of Returns
At the broadest level, all market profits arise from a limited set of economic activities.
These include collecting fees, providing capital, investing in illiquid assets, providing liquidity, and asset allocation. Most systematic trading strategies ultimately fall under asset allocation or liquidity provision, even when described differently.
This perspective matters because it clarifies what risks are being assumed. Providing liquidity entails inventory and microstructure risk. Asset allocation entails market risk, model risk, execution risk, and funding risk. Factor portfolios, trend-following CTAs, and statistical arbitrage funds all operate within this broader allocation framework, regardless of stylistic labeling.
Understanding where a strategy fits economically prevents category confusion. A trend-following program is not simply “momentum.” It is an allocation decision based on an assumption about the persistence of price dynamics. A statistical arbitrage model is not “riskless.” It is an allocation across relative mispricings with implicit factor and liquidity exposures.
Classification disciplines thinking.Strategy Types: Trend, Reversion, and Factor Exposures
The most commonly used classification framework divides strategies into types such as trend-following, mean reversion, statistical arbitrage, and factor-based approaches.
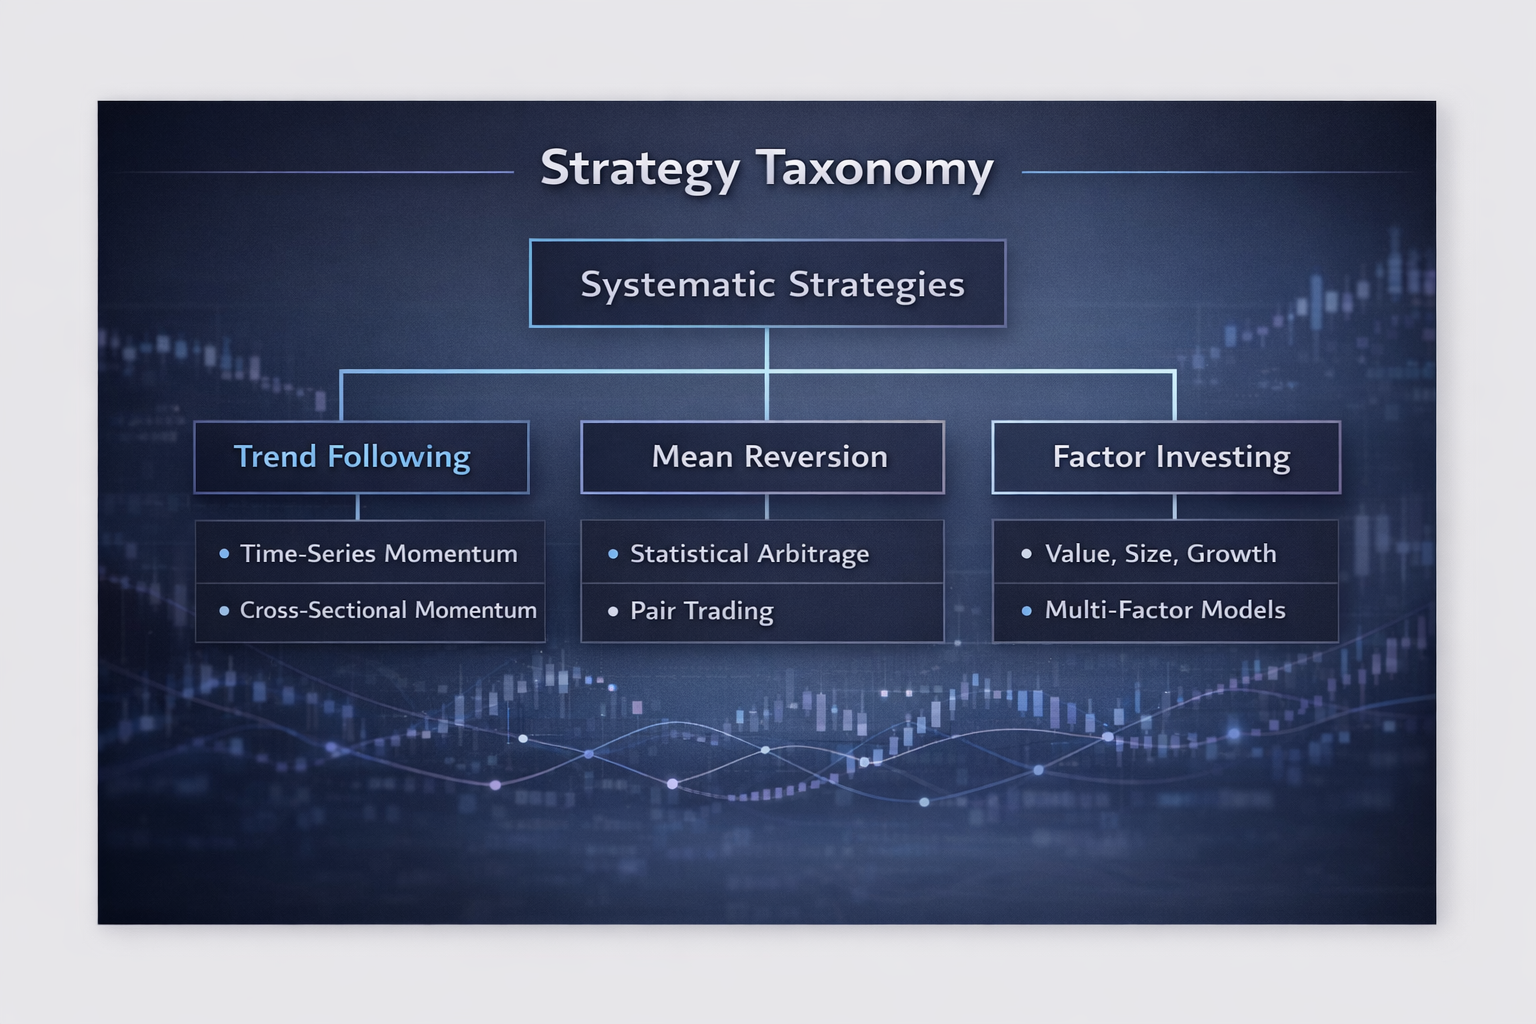
Figure 1: A high-level taxonomy of systematic strategies. The three branches are useful starting points, but as the next sections show, their boundaries are porous.
While simple, this taxonomy often obscures structural overlap. A cross-sectional momentum portfolio and a time-series momentum portfolio are both trend strategies, yet their risk profiles differ materially. A statistical arbitrage model may embed factor exposures unintentionally. A mean reversion system may in fact be short volatility.
For serious quants, labels are insufficient. Mechanisms must be examined.
Trend Following: Persistence as a Risk Premium
Trend-following strategies exploit the empirical persistence of price movements across assets, geographies, and timeframes.
Academic literature documents both cross-sectional momentum (buying recent winners and selling recent losers) and time-series momentum, where each instrument’s own historical performance determines positioning.
From a modeling standpoint, trend detection is often implemented through regression-based filters. Linear regressions, moving averages, and more advanced dynamic linear models such as Kalman filters serve as trend estimators.
In physics, momentum is defined as mass times velocity; in markets, it becomes the slope of price over time. The first derivative approximates trend. The second derivative signals turning points.
In physics, momentum is mass times velocity. In markets, it is the slope of price over time.The simplicity of moving averages belies their limitations. They introduce lag and can degrade in choppy regimes. More advanced state-space formulations reduce lag and allow recursive updating, making them attractive in latency-sensitive environments.
Exponential smoothing models, particularly Holt–Winters variants, embed trend and seasonality components and have been widely adopted by CTAs.
Yet trend following is not purely technical. Factor trend models extend the concept to derived series, allowing rotation across risk factors themselves.
In this sense, trend is not limited to price. It may exist in value, size, carry, or volatility regimes.
Trend-following returns are often characterized as convex to crisis environments, but they are also vulnerable to regime shifts and momentum crashes, particularly in cross-sectional implementations.
Mean Reversion and Relative Value: Trading Around Equilibrium
If trend-following assumes persistence, mean reversion assumes boundedness. These strategies operate on the premise that prices fluctuate around a fair value or equilibrium and that deviations are temporary.
Traditional band-and-midpoint models such as Bollinger Bands operationalize this idea by defining a central tendency and constructing volatility-based bands around it.
Signals are generated when price reaches statistical extremes. While technically simple, these frameworks are conceptually foundational: divergence from equilibrium implies expected convergence.
Modern statistical arbitrage extends this logic beyond single instruments. Rather than reverting to a moving average, spreads between related instruments (pairs, baskets, or factor-neutral portfolios) are modeled for co-integration or statistical dependence.
These approaches are not pure arbitrage in the law-of-one-price sense; they involve probabilistic convergence and therefore carry model risk and liquidity risk.
Importantly, statistical arbitrage is capacity constrained. As capital flows increase, spread dynamics change. Structural advantages, such as regulatory segmentation or capital controls, can temporarily preserve mispricings, but equilibrium pressures remain powerful.
Mean reversion and trend following are often treated as opposites, but at a deeper level both are statements about the second derivative of price dynamics. A contrarian strategy may simply be trading a change in slope. The distinction lies in the assumed dominant regime.
Factor Strategies: From Description to Allocation
Factor models introduce a different dimension. Rather than focusing directly on price patterns, they decompose returns into exposures to systematic risk drivers.
At their core, factor models are regression frameworks. The Capital Asset Pricing Model (CAPM) is a single-factor representation, while Fama–French extensions incorporate size, value, profitability, and investment factors.
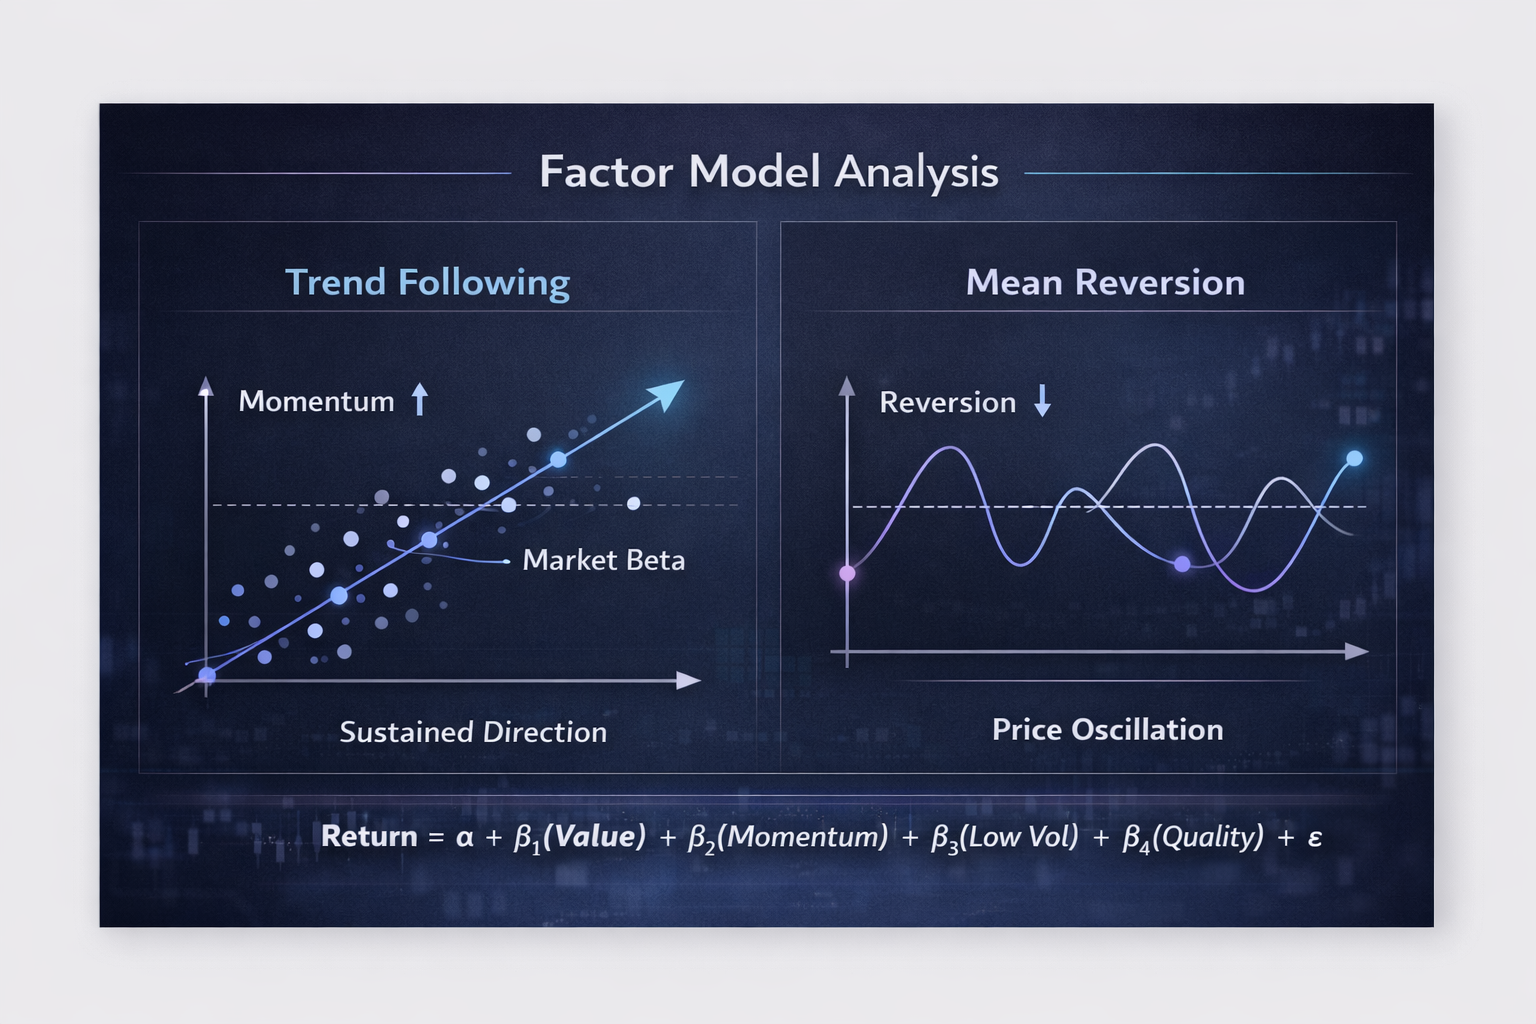
Figure 2: A factor regression provides a common language for both trend and mean-reverting behavior. Momentum and reversion are not opposites so much as different loadings on the same statistical scaffolding.
The evolution of factor research has produced what is often called a “factor zoo,” with hundreds of published anomalies.
For practitioners, the challenge is not discovering new factors but distinguishing structural premia from data-mined artifacts.
Factor strategies can be implemented through sorting (quantile portfolios), classification (clustering or machine learning segmentation), or direct weighting based on factor loadings.
Each method implies different turnover characteristics and exposure stability.
Crucially, factor models are easier to use descriptively than predictively.
Alpha in a regression is simply unexplained return, not evidence of skill. For serious quants, separating statistical residuals from genuine edge requires careful out-of-sample validation and awareness of structural factor drift.
Alpha in a regression is simply unexplained return, not evidence of skill.Overlaps and Hidden Exposures
A disciplined taxonomy reveals that these strategy families are not mutually exclusive. Cross-sectional momentum overlaps with value factors. Statistical arbitrage portfolios often embed unintended factor exposures. Trend-following funds may be long volatility in certain regimes and short volatility in others.
Style drift, intentional or otherwise, can alter a strategy’s effective exposure over time.
Factor analysis provides one mechanism for detecting this drift. In professional portfolio construction, understanding these hidden exposures is as important as signal generation.
From Taxonomy to Edge
For serious quantitative traders, classification is not an academic exercise. It determines risk budgeting, diversification logic, and capital efficiency. A portfolio that combines time-series momentum, cross-sectional value, and mean-reverting statistical arbitrage is not diversified if all three implicitly load on the same volatility regime.
The mature quantitative process therefore proceeds in layers. First, identify the economic activity: allocation, liquidity provision, or structural arbitrage. Second, classify the strategy type: trend, reversion, factor, or hybrid. Third, decompose exposures using regression or statistical factor models. Only then does signal refinement and parameter optimization begin.
The industry has spent decades refining signal processes. Less attention has been paid to structural coherence. Yet sustainable edge rarely comes from marginal improvements in moving average parameters. It comes from understanding where in the market ecosystem a strategy operates and why returns should exist at all.
This is the discipline DAZH is built around. The platform's workflow walks a trader through the stack in order: indicator selection, signal construction, rule logic, action mapping, backtest execution, then parameter optimization. That sequence mirrors the mature quantitative process. A strategy is not committed to capital until its economic activity, its regime dependence and its cost-adjusted behaviour have all been expressed and tested. Taxonomy stops being a paper exercise and becomes part of how the strategy actually gets built. The platform is live at www.zudora.in.
A taxonomy does not generate alpha. But without one, alpha is almost impossible to identify.