
A trading record can post a handsome annual return and still hide the number that decides whether a real person, watching real money fall, would have stayed in long enough to collect it: the drawdown. That number is the decline in equity from a high point to the low point that follows, before the account climbs back to a new high. A return tells you where a strategy ended; a drawdown tells you what it put you through to get there.
Definition
"A drawdown is the decline in equity from a peak to the lowest point that follows, before a new peak is set; maximum drawdown is the deepest such fall over a period."
The term has a precise meaning. A drawdown is a peak-to-trough decline, measured as a percentage of the peak. Maximum drawdown, the figure most often quoted, is the deepest peak-to-trough fall in the period, measured from a high to the lowest point that follows it before a new high is set. Unlike volatility (the standard deviation of returns, a measure of how much they swing in either direction), which treats a move up and a move down the same way, drawdown counts only the downside, the part a trader feels as loss.
Counting only the downside is exactly why drawdown matters: a strategy is judged as much by how far it falls along the way as by how much it makes, because the fall is what tests whether a trader holds on. As the CFA Institute's Prasad Ramani put it, maximum drawdown is the measure clients reach for when the value of a portfolio is set against the market's worst stretch, precisely when ordinary volatility numbers stop describing the danger.
A return tells you where a strategy ended; a drawdown tells you what it put you through to get there.What a drawdown measures, and maximum drawdown
A drawdown is path-dependent, which is what separates it from a simple loss. It begins the moment equity turns down from a high, deepens as the decline continues, and ends only when the account reclaims that prior high. Maximum drawdown records the deepest of those episodes over the period under review. Figure 1 shows the shape: a peak, the trough that follows, the depth measured between them, and the climb back to the old high.
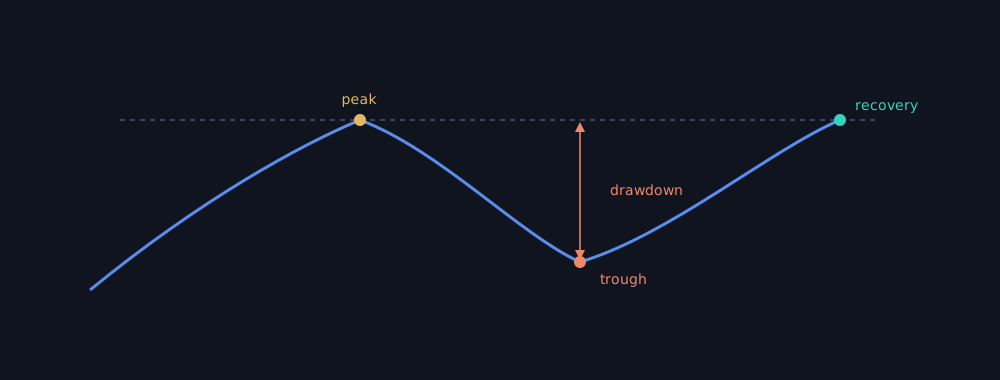
Figure 1: A drawdown is the peak-to-trough fall in equity; recovery is the climb back to the prior high.
Because it counts only the descent, drawdown captures risk the way a trader experiences it, as the account dropping from a high while the next move is still unknown. That is a different question from how scattered the returns are around their average, which is what standard deviation describes. Two strategies can share the same volatility and the same average return while one of them passes through a fall the other never approaches. The headline numbers would not tell them apart. The drawdown would.
Drawdown captures risk the way a trader experiences it, as the account dropping from a high while the next move is still unknown.Drawdown is historical, but it can still carry forward-looking information. Studying mutual funds, Qing Yan and Timothy Brandon Riley found in the Financial Analysts Journal that maximum drawdowns are persistent, indicative of manager skill, and predictive of subsequent performance. Investors behave as if they already know this. The same study reported that fund flows decline as drawdowns deepen, even after accounting for ordinary performance measures.
The recovery math behind a 50% drawdown
A drawdown is harder to undo than to suffer, and the arithmetic works against you. A loss is taken on the full balance, but the gain needed to recover is earned on the smaller balance that is left. The gap between the two widens as the loss deepens.
Drawdown % = (Peak Equity − Trough Equity) ÷ Peak Equity × 100

Recovery Gain Required = Drawdown ÷ (1 − Drawdown)
Take a round number. A 50% drawdown turns ₹100 of equity into ₹50, and climbing back to ₹100 takes a 100% gain, not another 50%, because the account must now gain ₹50 on a base of ₹50. The second formula holds generally: the gain required to recover equals the drawdown divided by what remains after it, and it climbs steeply as the hole deepens.
| Drawdown | Gain needed to recover |
|---|---|
| 10% | 11.1% |
| 20% | 25.0% |
| 30% | 42.9% |
| 40% | 66.7% |
| 50% | 100.0% |
| 60% | 150.0% |
| 75% | 300.0% |
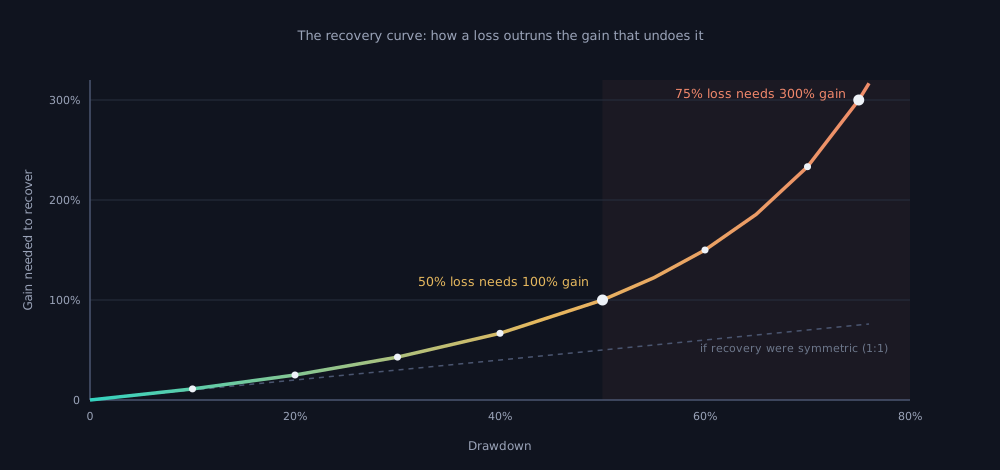
Figure 2: The recovery curve. The gain needed to undo a loss rises far faster than the loss itself, and past roughly half the account it turns nearly vertical, which is why deep drawdowns are so dangerous.
A 50% drawdown turns ₹100 of equity into ₹50, and climbing back to ₹100 takes a 100% gain, not another 50%.The practical lesson sits inside that curve, plotted in Figure 2. Shallow drawdowns are routine and recoverable; deep ones can be mathematically out of reach for a strategy whose realistic returns were never large enough to double the account. This is the link between drawdown and the risk of ruin, the chance that losses run far enough to end the account before any edge can play out. It is also why position sizing is, at heart, drawdown control. Sizing each trade so the worst plausible run of losses stays within a survivable band is what keeps a strategy on the right side of the recovery curve. A smoother return stream is not just more comfortable; it gives the strategy more room to survive long enough for its edge to play out.
Duration: the time spent underwater
Depth is only half of a drawdown. The other half is how long it lasts: the stretch between the old peak and the day the account finally reclaims it, called the time under water. A deep drawdown that recovers in weeks is a different experience from a shallow one that grinds on for two years.
Holding through a fall is one demand; holding through a long, flat, losing season while a strategy fails to make new highs is another, and it is usually the harder one. David Bailey and Marcos López de Prado formalized the cost of that wait. Under standard assumptions, their Triple Penance Rule finds that the time to recover from a drawdown runs about three times the period it took to reach the loss, which is why they argue a strategy should be judged on its time under water, not its depth alone.
A deep drawdown that recovers in weeks is a different experience from a shallow one that grinds on for two years.For a trader, duration is the quiet reason systems get abandoned. A rule set is easiest to follow when it is winning and hardest when it has been underwater long enough to feel broken. That is often the moment just before recovery, which makes the time dimension a behavioural risk as much as a financial one. A paper-trading run is one place a long flat stretch reveals whether the discipline actually holds, a point explored in paper trading versus backtesting.
Reading drawdown in strategy evaluation
Together, depth and duration make drawdown a test you can run on a strategy before committing capital. A backtest that reports a strong return and nothing about its worst fall has answered the easy question and skipped the hard one. The deepest drawdown in the historical record, how long it took to recover, and how often the strategy was underwater are the figures that say whether the same record could have been lived through, not just achieved on a chart.
Consider two strategies a backtest might hand you.
| Strategy | Annual return | Maximum drawdown | Time underwater | Survivable in practice? |
|---|---|---|---|---|
| Strategy A | 32% | 55% | 11 months | Hard to hold |
| Strategy B | 22% | 14% | 2 months | Far easier to hold |
Illustrative figures, not a real strategy or a recommendation.
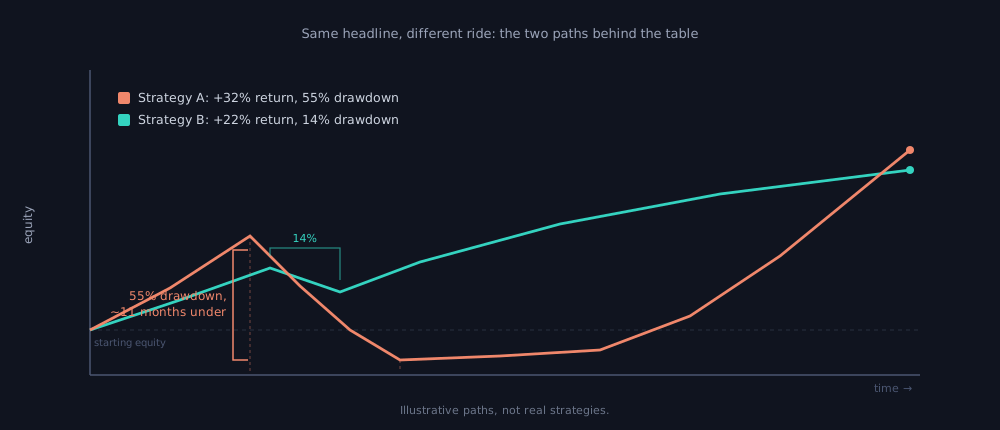
Figure 3: The same two strategies drawn as equity curves. Strategy A ends higher, but only after a fall few traders would sit through; Strategy B's smoother path is the one most people could actually hold.
Figure 3 draws the two as equity curves. On headline return, Strategy A wins. On the question that decides whether a trader stays in the seat, it does not. A 55% drawdown needs roughly a 122% gain just to return to the prior peak, and it keeps the account underwater for the better part of a year, long enough for most people to abandon the system at the worst possible moment. The better strategy is not always the one with the highest return; it is the one whose path a trader can actually live through.
Before deploying a strategy, read its drawdown the way you would have to live it. A short checklist for any backtest:
- Maximum drawdown: how deep was the worst peak-to-trough fall, and what gain would it take to recover?
- Time under water: how long was the longest recovery, and could you hold through it?
- Frequency: how often did the strategy fall into meaningful drawdowns, not just once?
- Position sizing: does the worst historical drawdown sit inside the loss budget you set per trade?
- Margin of safety: assume the real worst case is deeper than the record shows, and check the strategy still survives it.
That reading also disciplines position sizing. Once the worst historical drawdown is known, it sets a budget: how large each position can be so that a repeat of that fall, or a worse one, still leaves the account inside the recovery curve rather than past it. None of this forecasts the next loss. A backtested drawdown describes history under a set of assumptions, and the real worst case is always allowed to be deeper than the recorded one. Measuring it is preparation, not a forecast: you size and select a strategy so its worst stretch stays survivable.
A drawdown, then, is the part of the story a return leaves out, and reading it well is how you judge whether a strong-looking record was survivable in practice. Any serious strategy-validation workflow should surface all of it, the depth of the worst fall, the time spent underwater, and what it implies for position sizing, before a rupee of capital is deployed. That is the role daZh by Zudora is designed to play: the validation layer between a trading idea and live capital. A backtest cannot promise the next drawdown will be shallow, but it can show you the one you would have had to live through, while learning it is still cheap.
Related concepts
- Sharpe ratio, the companion measure of return earned per unit of risk.
- Strategy validation, the process that surfaces a strategy's worst fall before live capital.
- Paper Trading vs Backtesting.
Disclaimer: daZh is a software platform for building, testing, and managing user-defined trading strategies. It does not provide investment advice, stock recommendations, guaranteed returns, or profit assurance. Backtests are based on historical data and assumptions; actual trading results may differ.
Sources
- Corporate Finance Institute, "Maximum Drawdown", concept reference, accessed June 2026. https://corporatefinanceinstitute.com/resources/career-map/sell-side/capital-markets/maximum-drawdown/
- Prasad Ramani, CFA, "Sculpting Investment Portfolios: Maximum Drawdown and Optimal Portfolio Strategy", CFA Institute Enterprising Investor, February 12, 2013. https://rpc.cfainstitute.org/blogs/enterprising-investor/2013/sculpting-investment-portfolios-maximum-drawdown-and-optimal-portfolio-strategy
- Qing Yan and Timothy Brandon Riley, CFA, "Maximum Drawdown as Predictor of Mutual Fund Performance and Flows", Financial Analysts Journal, August 23, 2022. https://rpc.cfainstitute.org/research/financial-analysts-journal/2022/maximum-drawdown-as-predictor-of-mutual-fund-performance-flows
- David H. Bailey and Marcos López de Prado, "Stop-Outs Under Serial Correlation and 'The Triple Penance Rule'", SSRN working paper (published as "Drawdown-Based Stop-Outs and the 'Triple Penance' Rule", Journal of Risk, Vol. 18, No. 2, 2014). https://papers.ssrn.com/sol3/papers.cfm?abstract_id=2201302
- Investopedia, "Drawdown", orientation reference, accessed June 2026. https://www.investopedia.com/terms/d/drawdown.asp