
Walk-forward analysis is a validation method that repeatedly optimises a trading strategy on one window of history, called the in-sample period, then tests it untouched on the window that immediately follows, called the out-of-sample period. That pair then rolls forward, step by step, across the whole data set.
Instead of tuning a strategy once and judging it on the same data it was tuned against, walk-forward analysis separates the two jobs at every step, so performance is measured only on data the optimiser never saw. That separation is what makes it one of the more demanding tests a strategy can be put through.
Definition
"Walk-forward analysis optimises a strategy on an in-sample window of history, then measures its performance only on the out-of-sample window that immediately follows, and repeats this across the data so the strategy is judged the way it would actually be run and re-tuned over time."
The method was introduced by Robert Pardo, first in his 1992 book and then in its expanded edition, "The Evaluation and Optimization of Trading Strategies", where he set out walk-forward analysis as the standard for testing whether an optimised strategy holds up on new data or is merely curve-fitted, shaped so tightly to one stretch of history that it captures noise rather than any lasting signal. The intuition is plain. A strategy is only useful if it works on data it has not already been shaped around, and the only honest way to check that is to keep optimisation and testing in separate windows, again and again.
Instead of tuning a strategy once and judging it on the same data it was tuned against, walk-forward analysis separates the two jobs at every step.What walk-forward analysis is
A standard backtest runs a fixed set of rules across a stretch of history and reports how that exact strategy would have behaved. The trouble starts when the rules carry adjustable parameters, such as a moving-average length or a stop distance, that are tuned to make the same backtest look its best.
Tune enough of them against one fixed past and the strategy starts to fit the noise in that past rather than any signal that will persist. The result reads beautifully and means very little.
Walk-forward analysis is built to close that loophole. It tests the fitting procedure itself, whether the parameters it produces go on to work on the next, unseen stretch of data. Optimisation happens inside each in-sample window, and the verdict is read entirely from the out-of-sample window that follows it.
Because the procedure is repeated across the data, the out-of-sample results from each step are stitched together into a single record of how the strategy performed on data it was never optimised against.
How walk-forward analysis works
The mechanics are a loop. Take an in-sample window, say the first stretch of the data, and optimise the strategy on it to find the parameters that performed best. Lock those parameters and apply them, unchanged, to the out-of-sample window that comes immediately after, and record the result.
Then slide the whole pair forward by the length of that out-of-sample window and repeat: re-optimise, test on the new out-of-sample period, and record. Each step re-tunes the strategy the way a real desk re-optimises a live system as fresh data arrives, which is why the out-of-sample record is treated as a closer proxy for live trading than a one-shot backtest.
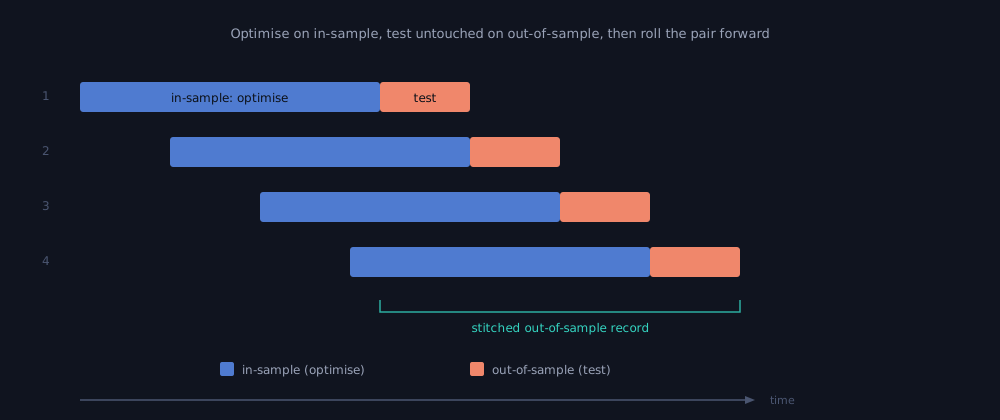
Figure 1: Walk-forward analysis as a sliding pair. A longer in-sample window optimises the strategy, the shorter out-of-sample window tests it untouched, and the pair steps forward across the data, again and again.
Figure 1 also marks the main design choice: what happens to the in-sample window as the test rolls on. In a rolling walk-forward, the in-sample window is a fixed length that slides forward, always training on the most recent stretch and letting older data drop off, which keeps the parameters responsive to recent conditions.
In an anchored walk-forward, the start of the in-sample window stays pinned to the beginning of the data while its end keeps extending, so the training set grows at every step and the parameters settle on a longer history. Rolling adapts faster to changing markets; anchored leans on more data for steadier parameters, so the choice follows the strategy and the market it trades.
| Method | How it works | Best suited for | Trade-off |
|---|---|---|---|
| Rolling walk-forward | The training window slides forward and drops old data | Regime-sensitive strategies | More responsive, less historical depth |
| Anchored walk-forward | The training window starts fixed and grows over time | Slower-moving strategies | More data, slower to adapt |
How to read it
The headline figure most often read off a walk-forward run is its walk-forward efficiency. Pardo defines it as the ratio of the strategy's annualised out-of-sample return to its annualised in-sample return, a measure of how much of the optimised, in-sample performance survived into live-like, out-of-sample trading.
WFE = annualised out-of-sample return / annualised in-sample return
If a strategy earns an annualised 20% inside the windows it was optimised on and 12% on the windows that followed, its walk-forward efficiency is 60%.
A higher ratio suggests that more of the in-sample performance carried over, instead of evaporating the moment the strategy met new data. As a rough working line, TradeStation's walk-forward documentation treats a walk-forward efficiency around 50% to 60% or above as a sign the strategy held up, while a ratio far below that points to optimisation that fitted the in-sample noise and did not generalise. The number is a guide, and it is read alongside the consistency of the out-of-sample results across the individual steps. A strategy that passes one window handsomely and several others poorly is weaker than its average suggests. The threshold is not universal: a short-term options strategy, a slower equity trend strategy, and a diversified portfolio can all deserve different expectations, so walk-forward efficiency is best read as evidence of carryover, not as a pass-or-fail stamp.
Read window by window, a handful of patterns recur, and each points somewhere.
| Walk-forward result | What it suggests |
|---|---|
| Most out-of-sample windows profitable | The edge may be persistent |
| One large window carries the result | The strategy may depend on one regime |
| In-sample strong, out-of-sample weak | The optimisation may not generalise |
| Performance degrades gradually | The edge may be regime-sensitive |
| Performance collapses after costs and slippage | The edge may only exist in ideal fills |
| Parameters change wildly each window | The strategy may be unstable |
A worked example makes the point. Five windows, each with its in-sample and out-of-sample return:
| Window | In-sample return | Out-of-sample return | Read |
|---|---|---|---|
| 1 | 18% | 11% | Held up |
| 2 | 21% | 13% | Held up |
| 3 | 16% | -2% | Failed window |
| 4 | 19% | 10% | Held up |
| 5 | 20% | 12% | Held up |
Illustrative figures, not a real strategy or a recommendation.
A walk-forward result is not judged only by the average. The distribution of windows matters: a strategy that passes four windows modestly and fails one small window is very different from one whose entire result rests on a single excellent window. Figure 2 plots the same five windows side by side.
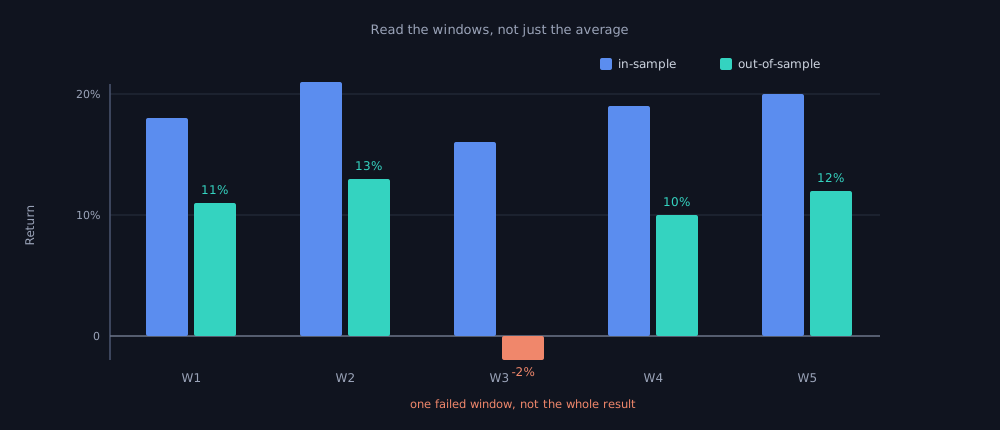
Figure 2: Read the windows, not just the average. Four of the five out-of-sample windows held a positive return; window 3 failed and dipped below zero. A single failed window among several that held is a different signal from one window carrying the whole result.
A higher ratio suggests that more of the in-sample performance carried over, instead of evaporating the moment the strategy met new data.Limits and pitfalls
Walk-forward analysis is among the stronger defences against overfitting, and treating it as a cure is its own mistake. The CFA Institute, describing the rolling-window method in its reading on backtesting and simulation, notes that even this more realistic procedure cannot fully account for the randomness in asset returns, particularly on the downside, and that markets carry structural breaks a single historical record may never show.
The deeper limit is that every walk-forward run, however many steps it contains, still rests on one historical path: the single sequence of prices that actually occurred. Marcos López de Prado, in Advances in Financial Machine Learning, argues that a single walk-forward path is itself easy to overfit precisely because it tests on one ordering of history, and that a more honest read comes from examining many combinations of training and testing data rather than one chain of them.
There is also a quieter trap: run the same data through many walk-forward configurations, picking the window lengths and step sizes that flatter the result, and the test meant to catch overfitting becomes another way to commit it. Walk-forward analysis narrows the risk that a strategy was fitted to noise. It does not, and cannot, remove it.
Walk-forward analysis narrows the risk that a strategy was fitted to noise. It does not, and cannot, remove it.A checklist before you trust a walk-forward result
Before trusting a walk-forward result, ask:
- Were the window lengths chosen before seeing the final result?
- Was each out-of-sample window truly untouched?
- Did the strategy pass across many windows, or only one?
- Did costs, slippage, and execution assumptions stay realistic?
- Were the parameters stable, or wildly different across windows?
- Did the result survive both strong and weak market regimes?
- Was walk-forward efficiency read alongside drawdown, trade count, and tail risk?
- Was the walk-forward setup itself over-optimised?
This is the layer daZh by Zudora is built to occupy, the validation layer between a trading idea and live capital. Walk-forward analysis sits inside a wider sequence of checks there, alongside out-of-sample testing and Monte Carlo simulation, so the question of whether an edge survives re-optimisation is answered on a test rather than on an account. A strategy that walks forward well still carries no promise. What it carries is a verdict reached, repeatedly, on data that played no part in its tuning.
Related concepts
- Out-of-sample testing: the single-split idea that walk-forward analysis repeats and rolls forward across the data.
- Overfitting: the failure mode walk-forward analysis is built to expose, where a strategy fits noise rather than signal.
- Monte Carlo simulation: the robustness check that probes the luck in a result a walk-forward run still leaves on one path.
- Strategy validation: the full sequence of checks an edge passes before any capital is committed.
Disclaimer: daZh is a software platform for building, testing, and managing user-defined trading strategies. It does not provide investment advice, stock recommendations, guaranteed returns, or profit assurance. Backtests are based on historical data and assumptions; actual trading results may differ.
Sources
- Robert Pardo, "The Evaluation and Optimization of Trading Strategies", Wiley, 2008 (expanded edition of "Design, Testing, and Optimization of Trading Systems", 1992). https://onlinelibrary.wiley.com/doi/10.1002/9781119196969.ch11
- CFA Institute, "Backtesting and Simulation", CFA Program refresher reading, 2026 curriculum. https://www.cfainstitute.org/insights/professional-learning/refresher-readings/2026/backtesting-and-simulation
- Marcos López de Prado, "Advances in Financial Machine Learning", Wiley, 2018. https://www.wiley.com/en-us/Advances+in+Financial+Machine+Learning-p-9781119482086
- TradeStation, "Walk-Forward Summary (Out-of-Sample)" and Walk-Forward Efficiency documentation, orientation reference, accessed June 2026. https://help.tradestation.com/09_01/tswfo/topics/walk-forward_summary_out-of-sample.htm