
A strategy that wins on seven trades out of ten feels like a winner. Then the three losses turn out to be three times the size of the seven wins, and the account is quietly bleeding. Win rate alone never settled the question of whether a strategy makes money. Trading expectancy does: it is the average amount a strategy wins or loses per trade, once both how often it wins and how much it wins or loses are folded into a single number.
Definition
"Trading expectancy is the average profit or loss a strategy can expect per trade, calculated as the win rate times the average win, minus the loss rate times the average loss."
The idea is the trading form of expected value, which the CFA Institute curriculum defines as the probability-weighted average of the possible outcomes of a random variable. Each outcome is weighted by how likely it is, and the weighted outcomes are summed. A trade has two broad outcomes, a win and a loss, so its expected value is the win weighted by the win rate plus the loss weighted by the loss rate. The trading psychologist Van K. Tharp made the measure a standard tool in his 2007 book Trade Your Way to Financial Freedom, defining a system's expectancy as how much you can expect to make on average, per unit risked, over many trades. The structure is the whole point. Frequency of winning and size of winning are pulled into one figure, and neither one alone can hide inside it.
Win rate alone never settled the question of whether a strategy makes money.What expectancy actually measures
Expectancy answers a single question: averaged over many trades, how much does this strategy make or lose each time it is run? A positive expectancy after costs is an edge; a negative one is a slow leak no win rate can patch. A strategy with an expectancy of ₹600 per trade is, on average, adding ₹600 to the account every time it takes a position, even though no individual trade will return exactly that. A strategy with an expectancy of minus ₹200 is doing the reverse, regardless of how often it shows a green day.
That makes expectancy the bridge between two numbers traders quote in isolation and trust too much. The first is the win rate, the share of trades that close in profit. The second is the size of the average win against the average loss, sometimes called the payoff or reward-to-risk ratio. Either number on its own is silent about profitability. A strategy can win often and still lose money, or win rarely and still compound, and only the two together, which is what expectancy combines, decide which.
Figure 1 shows the structure. Expectancy is what is left after the expected loss is subtracted from the expected gain, and the sign of that remainder is the entire verdict.
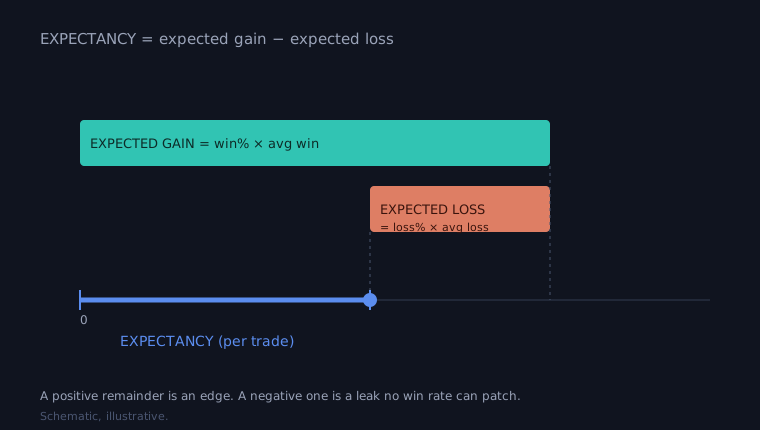
Figure 1: Expectancy is the expected gain from wins minus the expected loss from losses; the remainder, positive or negative, is the per-trade edge. Illustrative figures.
How trading expectancy is calculated
The calculation needs four numbers from a track record or a backtest: the win rate, the loss rate, the average win, and the average loss. The win rate is winning trades divided by total trades; the loss rate is the rest, so the two always sum to one. The average win and average loss are the mean profit on winners and the mean loss on losers.
Expectancy = (Win rate × Average win) − (Loss rate × Average loss)

Win rate = winning trades / total trades
Loss rate = losing trades / total trades = 1 − Win rate
Average win = the mean profit on winning trades
Average loss = the mean loss on losing trades

In R-multiples:
Expectancy (R) = (Win rate × Average win in R) − (Loss rate × Average loss in R)
1R = the amount risked per trade
Take a concrete example. Suppose a backtest of a trend-following strategy on NSE futures produces the numbers below: it wins less than half the time, but it lets winners run and cuts losers short.
| Input | Value |
|---|---|
| Win rate | 40% |
| Loss rate | 60% |
| Average win | ₹3,000 |
| Average loss | ₹1,000 |
| Expected gain from wins (0.40 × ₹3,000) | ₹1,200 |
| Expected loss from losses (0.60 × ₹1,000) | ₹600 |
| Expectancy per trade | ₹600 |
Illustrative figures, not a real strategy or a recommendation.
The strategy is wrong more often than it is right, yet its expectancy is a healthy ₹600 per trade, because each win is three times the size of each loss. Figure 2 plots the same arithmetic as a waterfall: the ₹1,200 of expected gain, the ₹600 of expected loss taken back, and the ₹600 that remains.
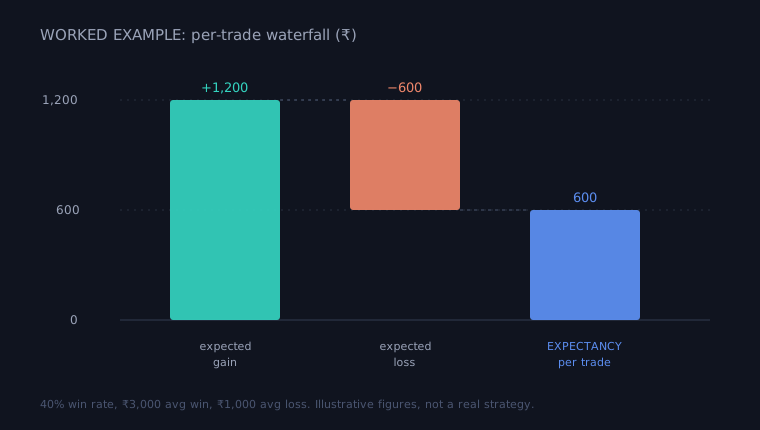
Figure 2: The worked example as a waterfall. Expected gain of ₹1,200, less expected loss of ₹600, leaves an expectancy of ₹600 per trade. Illustrative figures, not a real strategy or a recommendation.
The same result reads more cleanly in R-multiples, the framework Van Tharp built the measure on. R is the amount risked on a trade, usually the distance from entry to the stop-loss. A win of three times the risk is +3R; a loss of the full risk is minus 1R. Here, if 1R is ₹1,000, the average win is 3R and the average loss is 1R, so the expectancy is 0.40 times 3R minus 0.60 times 1R, which is 0.6R per trade. Expressed this way, expectancy is simply the mean R-multiple a system produces, and it lets a trader compare strategies of different position sizes and instruments on one scale, because every result is measured in units of risk rather than rupees.
A positive expectancy after costs is an edge; a negative one is a slow leak no win rate can patch.Why win rate alone misleads
The most useful thing expectancy does is expose strategies that look good and are not. A high win rate is comforting because being right feels like winning, but a strategy that wins often while letting its rare losses run can carry a negative expectancy and still feel successful for a long time. The two strategies below make the trap visible.
| Strategy | Win rate | Average win | Average loss | Expectancy per trade |
|---|---|---|---|---|
| A | 70% | ₹500 | ₹1,500 | -₹100 |
| B | 40% | ₹2,000 | ₹600 | +₹440 |
Illustrative figures, not a real strategy or a recommendation.
Strategy A wins seven trades in ten and loses money: 0.70 times ₹500 is ₹350 of expected gain, against 0.30 times ₹1,500, or ₹450 of expected loss, for an expectancy of minus ₹100 per trade. Strategy B wins fewer than half its trades and compounds: 0.40 times ₹2,000 is ₹800, against 0.60 times ₹600, or ₹360, for an expectancy of plus ₹440. A high win rate is not the same as a profitable strategy. Figure 3 runs both as equity curves over a long sample, and the high-win-rate strategy is the one that drifts down.
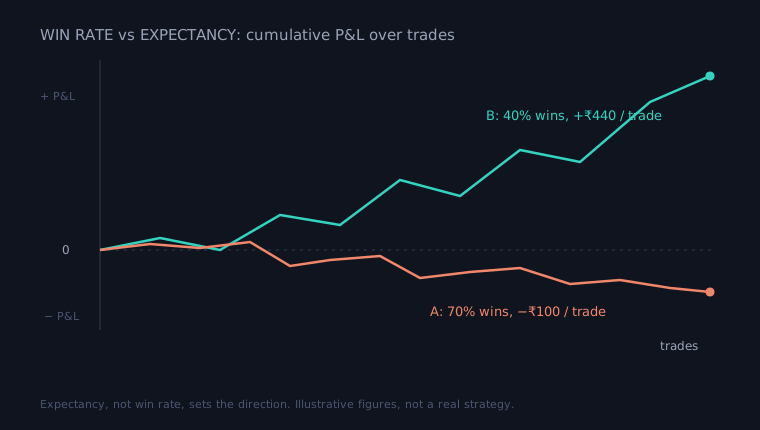
Figure 3: The two strategies as cumulative equity over many trades. The 70% win-rate strategy bleeds; the 40% win-rate strategy compounds, because expectancy, not win rate, sets the direction. Illustrative figures, not a real strategy or a recommendation.
A high win rate is not the same as a profitable strategy.This is also why expectancy has to be read together with how many trades a strategy takes. A per-trade edge only becomes real money when it is repeated, so the total a strategy is expected to produce is its expectancy multiplied by the number of trades it gets to make. An expectancy of ₹600 per trade across 200 trades is an expected ₹1.2 lakh; the same edge across 20 trades is an expected ₹12,000. A large edge on a strategy that rarely trades and a small edge on one that trades constantly can land in the same place. Expectancy tells you the quality of each bet; the count of opportunities tells you how much that quality is allowed to add up to.
Expectancy is not the same as total return
Expectancy is a per-trade figure, not a strategy's bottom line. What an account actually earns depends on how often the edge repeats and what the path costs along the way, so expectancy sits beside several other numbers rather than standing in for them.
| Metric | What it tells you |
|---|---|
| Expectancy per trade | The quality of each trade |
| Number of trades | How often the edge appears |
| Total expected profit | Expectancy × number of trades |
| Drawdown | The path endured while earning it |
| Risk of ruin | Whether the account survives long enough to collect it |
Read together, these separate a strong per-trade edge from a strong outcome. A high expectancy on a strategy that rarely trades, or one whose drawdown forces a trader out, does not turn into return until the trades are taken and the path is survived.
Reading expectancy, and what it cannot tell you
A positive expectancy is necessary, but it is not the same as a strategy you can safely trade, and three limits matter most.
The first is that expectancy is an average, and an average says nothing about the path. Expectancy is an average over many trades, not a promise about the next one. A strategy with a healthy positive expectancy can still string together a long run of losses, and if those losses arrive early or the position sizing is aggressive, the account can be wiped out before the edge ever shows up. This is why expectancy is read next to drawdown and the risk of ruin, and why position sizing is what turns a positive expectancy into a survivable one rather than a theoretical one.
Expectancy is an average over many trades, not a promise about the next one.The second is sample size. An expectancy figure is only as trustworthy as the number of trades behind it. A handful of trades can produce a flattering average by luck alone, the same way a few coin flips can come up heads. The CFA Institute, writing on backtesting, cautions that results drawn from limited data can reflect chance rather than a genuine, repeatable edge, and a high expectancy measured on twenty trades says far less than a modest one measured on a thousand. A single outsized win can also lift the average win enough to flip an expectancy positive, so it is worth checking whether the number survives the removal of the best one or two trades.
The third is that the inputs themselves can be wrong. An expectancy from a backtest inherits every assumption the backtest made. If the average loss in the test was smaller than a real stop would have filled at, or fees and slippage were understated, the true average loss is larger and the real expectancy is lower than the figure on the report. A measured edge that ignores costs is not the edge a trader will actually live.
A checklist before you trust expectancy
Before trusting an expectancy figure, ask:
- Is it positive after realistic fees, taxes, and slippage are subtracted from the wins and added to the losses?
- How many trades is it built on, and would it survive the removal of the best one or two?
- Does one outsized win or a single avoided loss carry the whole number?
- What is the worst drawdown the strategy passed through while earning this average?
- Does the position size keep that drawdown survivable, so the edge has time to play out?
- How many trades does the strategy actually get to make, so you know what the per-trade edge adds up to?
- Was it measured over a full market cycle, or only over a stretch that suited the strategy?
A trading idea earns its expectancy only inside a test, and the test is where the win rate, the payoff ratio, the costs, and the sample size either hold up together or quietly fall apart. Computing expectancy honestly, on realistic wins and losses, over enough trades, and then reading it next to drawdown and position sizing rather than alone, is part of putting validation between a trading idea and live capital. That is the layer daZh by Zudora is built to be: a place to test an idea against history, see the expectancy and the win rate and the losses it actually produced, and understand what the number can and cannot promise before any money is at stake. Expectancy describes an average, not the next trade. Reading it well means asking what produced the number before trusting it.
Frequently asked questions
What is trading expectancy?
Trading expectancy is the average profit or loss a strategy earns per trade, calculated as the win rate times the average win, minus the loss rate times the average loss. A positive figure is the per-trade edge.
How do you calculate expectancy in trading?
Multiply the win rate by the average win, then subtract the loss rate times the average loss. It needs four numbers from a track record or backtest: the win rate, the loss rate, the average win, and the average loss.
What is a positive expectancy?
A positive expectancy means a strategy adds money on average each time it takes a position, so it carries an edge. A negative expectancy means it loses on average, however often it shows a winning trade.
Is expectancy the same as the win rate?
No. The win rate is only how often a strategy wins, while expectancy also weighs how large the wins and losses are. A strategy can win 40% of the time and still beat one that wins 70%, if its wins are large enough relative to its losses.
What is a good trading expectancy?
Any positive expectancy is an edge, but it has to survive realistic fees, taxes, and slippage and rest on enough trades to be trustworthy. A high figure measured on a handful of trades says far less than a modest one measured over many.
What is expectancy in R-multiples?
R is the amount risked on a trade, usually the distance from entry to the stop. Expressed in R, expectancy is the mean R-multiple a system produces, which lets strategies of different position sizes and instruments be compared on one scale.
Related concepts
- Win rate, the companion input expectancy keeps honest.
- Risk of ruin, the chance a losing streak ends the account before a positive edge can play out.
- Position sizing, what turns a positive expectancy into a survivable one.
- A Framework for Systematic Trading.
Disclaimer: daZh is a software platform for building, testing, and managing user-defined trading strategies. It does not provide investment advice, stock recommendations, guaranteed returns, or profit assurance. Backtests are based on historical data and assumptions; actual trading results may differ.
Sources
- Van K. Tharp, "Trade Your Way to Financial Freedom", 2nd edition, McGraw-Hill, 2007 (the originating source for trading expectancy and R-multiples). https://www.mheducation.com/highered/mhp/product/trade-your-way-financial-freedom.html
- Van Tharp Institute, "Tharp Think Trading Concepts" (expectancy as the mean R-multiple; R-multiple definition), accessed June 2026. https://vantharpinstitute.com/tharp-think-trading-concepts/
- CFA Institute, "Probability Trees and Conditional Expectations", 2026 CFA Program Level I Quantitative Methods refresher reading (expected value as the probability-weighted average of outcomes). https://www.cfainstitute.org/insights/professional-learning/refresher-readings/2026/probability-trees-and-conditional-expectations
- CFA Institute, "Backtesting and Simulation", CFA Program refresher reading, 2026 curriculum (sample-size and overfitting caveats on a measured edge). https://www.cfainstitute.org/insights/professional-learning/refresher-readings/2026/backtesting-and-simulation