
A strategy that wins eight of every ten trades sounds like a sure thing. Then you run it for a quarter and the account is smaller than when you started. The wins were real, but they were small, and the two losses each gave back more than several wins combined. This is the trap hiding inside a single, comforting number. In trading, win rate is the share of a strategy's trades that close in profit, and on its own it tells you almost nothing about whether the strategy makes money. A high win rate feels like safety, but it is only half of the equation. The other half is the reward-to-risk ratio: how large the average win is against the average loss.
Definition
"Win rate is the share of a strategy's trades that close in profit; read on its own it cannot tell you whether the strategy makes money, because that depends on how it combines with the reward-to-risk ratio, the average win measured against the average loss."
The reason these two numbers must be read together is that they multiply, they do not add. A win rate counts how often you are right. The reward-to-risk ratio counts how much each right answer is worth relative to each wrong one. Either number alone can be flattered or hidden. Together they produce expectancy, the single figure that says whether an edge exists at all.
Traders often call this the risk-reward ratio. This article uses reward-to-risk, because the ratio is expressed as the average win divided by the average loss, that is, reward over risk. The breakeven formula later in the page only reads correctly in that direction.
A high win rate feels like safety, but it is only half of the equation.What win rate really tells you
Win rate, sometimes called the hit rate or the percentage of winning trades, is the simplest performance statistic a trader can compute: take the number of trades that closed in profit and divide by the total number of trades. A strategy that closed 55 of its last 100 trades in the green has a win rate of 55%. Nothing more is built into it. It does not know how large those wins were, how deep the losses ran, or how long the capital was tied up to earn them.
That simplicity is exactly why the number is so easy to misread. A win rate of 90% sounds close to flawless, and many strategies that sell option premium or scalp tiny moves genuinely produce one. They are right almost every day. The risk is that the rare losing day is not a small giveback but a cliff: a single ₹6,000 loss that erases the last twenty ₹300 wins. The win rate never showed that asymmetry, because counting how often you win says nothing about the size of each outcome.
The opposite shape is just as common. A trend-following strategy might be wrong on two out of every three trades, a 33% win rate, and still compound steadily, because the third trade runs far enough to pay for the first two and then some. A strategy can be wrong most of the time and still make money, as long as its winners are large enough to pay for its losers. The win rate alone would make that strategy look weak. The full picture says otherwise.
A strategy can be wrong most of the time and still make money, as long as its winners are large enough to pay for its losers.How win rate and reward-to-risk combine into expectancy
The figure that ties the two halves together is expectancy: the average amount a strategy can expect to make, or lose, per trade taken over many trades. It is a straightforward expected value. You weigh each win by how often it happens and how large it is, then subtract each loss weighed the same way. Van Tharp popularised this framing for traders in Trade Your Way to Financial Freedom, where he recast every trade result as an R-multiple, a result expressed in units of the amount initially risked, so that a strategy's expectancy becomes the average R it returns per trade.
The reward-to-risk ratio, often written R, is the average win divided by the average loss. A strategy whose winners average ₹6,000 and whose losers average ₹3,000 has a reward-to-risk ratio of 2, each win is worth two losses. Combine that ratio with the win rate and the loss rate, which is simply one minus the win rate, and you have expectancy.
Expectancy (per ₹1 risked) = (Win rate × Average win) − (Loss rate × Average loss)

In R units:   E = (W × R) − ((1 − W) × 1)

W = win rate = the share of trades that close in profit
R = reward-to-risk ratio = (average win / average loss)
1 − W = loss rate = the share of trades that lose, each costing 1R

Breakeven win rate (the win rate where E = 0):   W* = 1 / (1 + R)
Win rate and reward-to-risk are two dials on the same machine, and only their product decides whether the machine makes money. Turn the win rate up and the required size of each win can fall. Stretch the reward-to-risk ratio and you can afford to be right far less often. This is the same trade-off that sits underneath optimal bet sizing: J. L. Kelly's 1956 paper in the Bell System Technical Journal derived the growth-optimal fraction of capital to stake as a function of the win probability and the payoff odds together, never one without the other.
The breakeven win rate for a given payoff
Setting expectancy to zero answers a practical question: for a given reward-to-risk ratio, how often do you need to be right just to break even? Solving the formula above gives a clean result. The breakeven win rate is one divided by one plus the reward-to-risk ratio. At a 1:1 payoff you need to win exactly half the time. As the payoff grows, the required win rate falls, because each win now covers more than one loss.
| Reward-to-risk ratio (R) | Breakeven win rate (W* = 1 / (1 + R)) | Reading |
|---|---|---|
| 0.5 (wins half the size of losses) | 66.7% | Must be right two times in three just to hold flat |
| 1.0 (wins equal losses) | 50.0% | The classic coin-flip line |
| 1.5 | 40.0% | Room to be wrong slightly more than half the time |
| 2.0 | 33.3% | Right one trade in three is enough to break even |
| 3.0 | 25.0% | Three wrong trades in four still breaks even |
| 5.0 | 16.7% | Wrong five times in six and still flat |
Breakeven win rate derived from the expectancy identity (E = 0); see the Van Tharp and Kelly sources.
Figure 1 plots that table as a curve. The breakeven line falls steeply as the reward-to-risk ratio rises, and the page splits into two regions: any win rate above the curve is profitable expectancy, anything below it bleeds. The shape is the whole lesson. You do not need a high win rate to make money, you need a win rate that sits above the line your payoff sets.
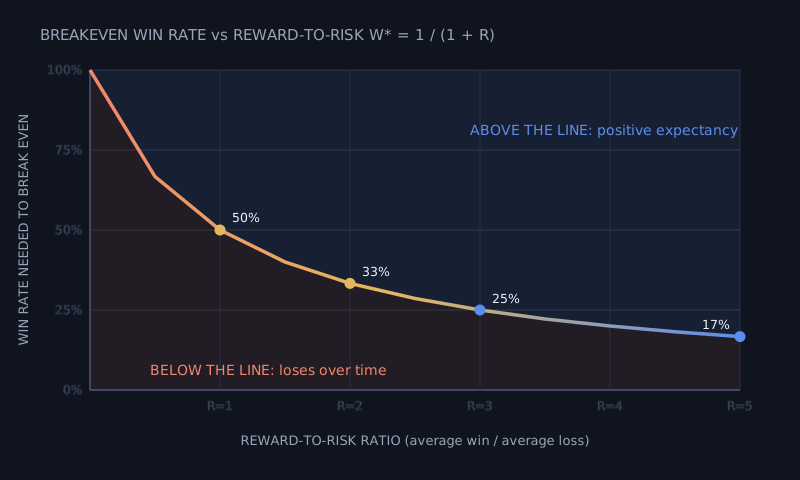
Figure 1: The breakeven win rate falls as the reward-to-risk ratio rises. Any combination above the curve has positive expectancy; any combination below it loses over time. Curve plots W* = 1 / (1 + R).
Win rate and reward-to-risk are two dials on the same machine, and only their product decides whether the machine makes money.How to read the two together
Because the two numbers trade off, a strategy is best judged by where it lands relative to its own breakeven line, not by either figure in isolation. Four illustrative systems make the point. Each has a different win rate and a different payoff, and the only number that settles the argument is the expectancy in the final column.
| System | Win rate | Avg win | Avg loss | Payoff (R) | Breakeven win rate | Expectancy / trade |
|---|---|---|---|---|---|---|
| A. Scalper | 70% | ₹2,000 | ₹3,000 | 0.67 | 60.0% | +₹500 |
| B. Balanced | 55% | ₹4,000 | ₹4,000 | 1.00 | 50.0% | +₹400 |
| C. Trend-follower | 35% | ₹9,000 | ₹3,000 | 3.00 | 25.0% | +₹1,200 |
| D. Premium-seller look-alike | 80% | ₹1,000 | ₹6,000 | 0.17 | 85.7% | −₹400 |
Illustrative figures, not a real strategy or a recommendation.
System D is the cautionary one. It wins 80% of its trades, the highest win rate on the table, and it still loses ₹400 a trade, because its breakeven win rate is 85.7% and 80% sits below it. System C wins only 35% of the time, the lowest, yet earns the most per trade, because a reward-to-risk ratio of 3 sets its breakeven line all the way down at 25%. The number to trust is not the win rate or the payoff ratio alone, but the expectancy they produce together.
The number to trust is not the win rate or the payoff ratio alone, but the expectancy they produce together.Figure 2 places the four systems on a single map. The horizontal axis is win rate, the vertical axis is reward-to-risk, and the curved boundary is the breakeven line that separates positive expectancy from negative. Systems A, B, and C sit above the boundary, in the profitable region. System D, despite being furthest to the right, sits below it. Position relative to the line is what matters, not how far right or how far up a strategy reaches on its own.
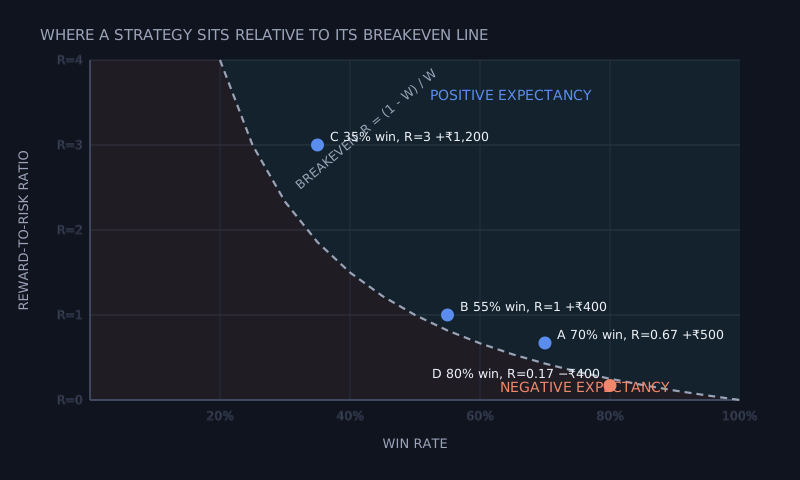
Figure 2: The same four systems placed on the win-rate and reward-to-risk plane. The curved line is breakeven; systems above it have positive expectancy, the one below it loses, regardless of its high win rate. Illustrative figures.
Limits and pitfalls
Even read together, the pair carries traps worth naming. The first is averages. Expectancy uses the average win and the average loss, but a strategy rarely loses exactly its average. One position that runs past its intended stop, a gap through a level on bad news, a day the exit could not fill, and a single loss can dwarf the average the formula assumed. A high win rate makes this worse, not better, because it lulls a trader into trusting a number that has not yet met its worst trade.
The second is sample size. A 70% win rate over 12 trades is barely more than noise. Van Tharp cautioned that a system's expectancy is only meaningful across a reasonably large number of trades, enough that the distribution of results, not a lucky streak, is what you are measuring. Win rate is especially seductive early, because a short run of wins reads as skill long before it is statistically real.
The third is that win rate and reward-to-risk are not independent in practice. Moving a profit target further out to lift the reward-to-risk ratio usually lowers the win rate, because price reaches a far target less often than a near one. Tightening a stop to cut the average loss does the same. You cannot freely improve one dial without paying on the other, which is why a backtest that shows both improving at once deserves suspicion. The CFA Institute's treatment of backtesting frames the whole exercise as approximating the real risk-return trade-off of a strategy, and a clean separation of these two numbers is one of the things a careful test is meant to expose.
The fourth is costs. Brokerage, the securities transaction tax, exchange and regulatory charges, and the gap between the price you wanted and the price you got all come out of the average win and add to the average loss. A strategy that breaks even on paper at a 50% win rate may need 54% once those frictions are charged. A win rate measured on gross trades flatters a strategy that a net measurement would mark down. Slippage alone can move a marginal edge to the wrong side of its breakeven line.
Gross versus net win rate
The win rate and reward-to-risk a backtest reports are usually gross, measured before the costs of trading. Costs do not fall evenly: they trim every winner and enlarge every loser, and near the breakeven line that is enough to flip the verdict.
| Before costs | After costs |
|---|---|
| Win rate looks stable | Some small winners turn into breakeven or losing trades |
| Average win looks larger | Brokerage, taxes, charges, and slippage reduce it |
| Average loss looks controlled | Slippage and gaps can enlarge it |
| Expectancy looks positive | Net expectancy may fall below zero |
A strategy should not be judged by gross win rate. The only win rate that matters is the one measured after costs, because that is the version the account actually receives.
A checklist before you trust win rate
Before trusting a win rate, ask:
- Is the reward-to-risk ratio reported next to it, never the win rate alone?
- What is the expectancy the two produce together, in rupees or in R per trade?
- Where does the strategy sit relative to its breakeven win rate, above the line or below?
- How many trades is the win rate measured over, enough to be more than a streak?
- Are the average win and average loss robust to one outsized losing trade?
- Were the numbers measured net of brokerage, taxes, charges, and slippage, or gross?
- Did improving one dial quietly worsen the other in the backtest?
- Does the win rate hold across different market regimes, or only one calm stretch?
A win rate and a reward-to-risk ratio are two readings of the same strategy, and neither means anything until you put them on the same line and ask what expectancy they make together. Computing that honestly, on a large enough sample, net of costs, and across more than one market regime, is part of putting validation between a trading idea and live capital. That is the layer daZh by Zudora is built to be: a place to test an idea against history, watch its win rate and its average win and loss emerge together, and see the expectancy they produce before any money is at stake. A high win rate cannot promise the next trade. Reading it next to reward-to-risk is how you find out whether there was an edge underneath it at all.
Frequently asked questions
What is win rate in trading?
Win rate is the share of a strategy's trades that close in profit: the number of winning trades divided by the total number of trades. A strategy that closed 55 of its last 100 trades in profit has a win rate of 55%.
What is a good win rate in trading?
There is no single good number, because win rate only makes sense next to the reward-to-risk ratio. A 35% win rate can be profitable when winners are large, while an 80% win rate can lose money when the losses are large enough.
How do you calculate the breakeven win rate?
The breakeven win rate is one divided by one plus the reward-to-risk ratio, written W* = 1 / (1 + R). At a 1:1 payoff you need to win half the time; at a payoff of 2 you need to win one trade in three.
Can a low win rate still be profitable?
Yes. A trend-following strategy can be wrong on two of every three trades and still compound, provided its winners run far enough to cover the losers and leave a profit on top.
What is the difference between win rate and risk-reward?
Win rate counts how often a strategy is right; the reward-to-risk ratio measures how large the average win is against the average loss. The two combine into expectancy, the figure that says whether an edge exists at all.
Why can a high win rate still lose money?
Because win rate ignores the size of each outcome. If the rare losses are far larger than the frequent wins, a strategy can sit below its breakeven win rate and lose over time even while winning most of its trades.
Related concepts
- Expectancy, the single figure win rate and reward-to-risk combine to produce.
- Position sizing, how much to stake once an edge is confirmed.
- Risk of ruin, the chance a real edge still blows up on a bad run.
- Strategy validation, the process where these numbers are tested honestly.
- A framework for systematic trading.
Disclaimer: daZh is a software platform for building, testing, and managing user-defined trading strategies. It does not provide investment advice, stock recommendations, guaranteed returns, or profit assurance. Backtests are based on historical data and assumptions; actual trading results may differ.
Sources
- Van K. Tharp, "Trade Your Way to Financial Freedom", 2nd edition, McGraw-Hill, 2007 (expectancy and R-multiples). https://books.google.com/books/about/Trade_Your_Way_to_Financial_Freedom.html?id=_hLzpVIg2sMC
- J. L. Kelly Jr., "A New Interpretation of Information Rate", Bell System Technical Journal, 1956, 35(4): 917 to 926. https://onlinelibrary.wiley.com/doi/abs/10.1002/j.1538-7305.1956.tb03809.x
- CFA Institute, "Backtesting and Simulation", CFA Program refresher reading, 2026 curriculum. https://www.cfainstitute.org/insights/professional-learning/refresher-readings/2026/backtesting-and-simulation