
Sell a Nifty at-the-money call and the put on the same strike and the same expiry, collect both premiums, and you have built a short straddle. The position makes its most money when the index does nothing: time drains both options, implied volatility eases, and the seller keeps what the market paid for movement that never arrived. On a calm chart, it can look like the closest thing in options to getting paid to wait.
That calm is the danger. A short straddle is a bet against motion, and the market's largest moves are the ones nobody scheduled. The most the position can ever make is the premium collected. The loss on the call side is theoretically unlimited as the index rises, and the loss on the put side grows large as it falls toward zero. This guide walks the rule in three steps, build, then backtest, then validate, and treats every setting as a hypothesis to test rather than advice to follow. For a position with undefined risk, validation is not the polish at the end. It is the part that decides whether the idea was ever safe to trade.
A short straddle is a bet against motion, and the market's largest moves are the ones nobody scheduled.What a short straddle is and how its legs are structured
A short straddle is two options sold at once on the same strike. The Options Industry Council defines it as "a combination of writing uncovered calls (bearish) and writing uncovered puts (bullish), both with the same strike price and expiration", usually placed at the money so the strike sits near the current price of the underlying. Writing, or selling, an option means collecting a premium now in exchange for the obligation to settle later if the option finishes in the money. Selling the call and the put together is a single short-volatility position: it profits when the underlying stays still and implied volatility, the market's expectation of future movement priced into option premiums, falls.
The payoff is the whole reason to be careful, and Figure 1 draws it. The maximum profit, per the Options Industry Council, "is limited to the premiums received at the outset", and it is earned only if the underlying closes exactly at the strike at expiry, leaving both options worthless. From that single peak the profit falls away in both directions. The two breakevens sit at the strike plus the total premium and the strike minus the total premium, the band inside which the position keeps something. Outside that band it loses. The loss is unlimited on the upside, because the index can keep rising, and substantial on the downside, capped only because the underlying can fall no lower than zero.
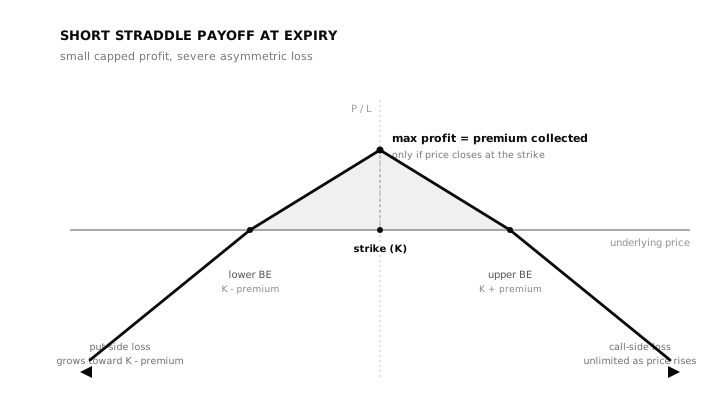
Figure 1: A short straddle's payoff is an inverted tent. Profit peaks at the strike and equals only the premium collected; outside the two breakevens the loss grows without limit on the upside and falls toward the strike less premium on the downside. Illustrative figures.
This makes the risk undefined and asymmetric, the single most important fact about the strategy. A defined-risk position, such as an iron condor or a bull call spread, caps its worst case the moment it is opened. A short straddle does not. It is short gamma, which means a move works against the position faster the further it travels, and the loss can far exceed the premium that was collected. The reward is small, known, and capped. The risk is large, open-ended, and arrives all at once. Everything that follows is built around that imbalance.
How to build it as a no-code rule set
A trading rule is a fully specified instruction with no room left for judgement, and a short straddle converts into one cleanly. The legs come first: sell one at-the-money call and one at-the-money put on the chosen index or stock, same strike, same expiry, one lot each so the structure stays balanced. The strike rule has to be exact, the nearest strike to the spot price at entry, because "at the money" drifts as the underlying moves and a vague rule is not testable.
Then the conditions. The entry can be as plain as a time of day, selling the straddle shortly after the open on an expiry day when time decay is fastest, or it can wait for a filter, an implied-volatility level or a quiet range, before allowing the trade. The exit is where an undefined-risk position earns or loses its discipline. A short straddle needs a stop, a rupee or percentage cap on the combined premium, because the structure has no built-in floor. It also needs a profit target, often a fraction of the premium collected, and a hard time exit that squares off near the close so nothing carries overnight into a gap. Figure 1's shape is the reason: without a stop, the left and right tails are the position's entire downside.
The exit is where an undefined-risk position earns or loses its discipline.Each of these is a separate hypothesis, not a setting to trade on faith. The strike distance, the stop size, the target, the entry filter, the choice of expiry day versus a positional hold, all of them change the risk and the return in ways an argument cannot settle. A wider stop survives more wiggles but bleeds more on the bad day. A tighter one trades calmer but gets shaken out of trades that would have worked. None of these is correct in the abstract. They are knobs to search honestly and then validate, never values to assume.
How to backtest it honestly
A backtest replays the rule against historical data and reports what it would have done. The CFA Institute frames the exercise as estimating "how would this strategy have performed if it were implemented in the past." For a short straddle that means reconstructing both option legs bar by bar from historical option prices, selling them at entry, marking the combined position through the session, and applying the stop, target, and time exit exactly as the rule would, then recording every trade and the running account balance.
Costs come first, and they bite harder here than on a stock rule. Every entry and exit is two option legs, not one, so each round trip pays brokerage on both, the securities transaction tax, exchange and regulatory charges, GST, and slippage, the gap between the price the rule wanted and the price it actually got. Option spreads widen exactly when the underlying is moving, which is exactly when a stop fires, so the assumed fill and the real fill diverge most at the worst moment. Liquidity makes it worse the further the strike sits from the money: at-the-money strikes are deep and tight, but a stop that has to buy back a leg that has run deep in the money is trading a thinner, wider market. A backtest that fills at the mid-price and ignores all of this shows a gross result that costs quietly erase. A result that does not state whether it is net of costs is not a result you can act on.
A result that does not state whether it is net of costs is not a result you can act on.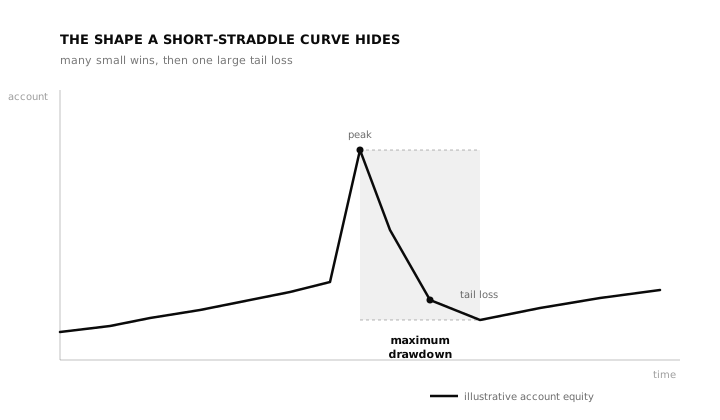
Figure 2: A short straddle's equity curve is deceptive by shape. It climbs in small steady steps as premiums decay, then gives a large chunk back in one move, so the average day flatters the rule and the worst day defines it. Illustrative figures.
The metrics matter in pairs of reward and pain, and for an option-selling rule the pain side decides everything. The compound annual growth rate, or CAGR, summarises the return, but it means little without the maximum drawdown, the largest peak-to-trough fall in the account, which is what a trader actually has to sit through. A short straddle wins often and small, then loses rarely and large, the shape Figure 2 shows, so a high win rate can hide a fragile rule. It can win nine expiries in ten and lose more on the tenth than it made on the other nine, which is why expectancy, the average outcome per trade after costs, is the honest summary, and why position sizing against the worst plausible loss matters more than the average one. Read the full trade record, and watch the single largest loss as closely as the total.
How to validate it
Validation is the step that separates a real edge from a flattering calm stretch, and the reason one good backtest proves almost nothing. A short straddle has only a handful of dials, the strike distance, the stop, the target, the entry filter, which makes it easy to sweep dozens of combinations and keep the one with the best historical curve. That is precisely how a rule gets fitted to the noise of one stretch of history, a trap called overfitting. Marcos Lopez de Prado, in Advances in Financial Machine Learning, shows that the more configurations you test, the more likely the best one is luck rather than skill. The winner of a parameter sweep is the most overfit setting in the set, not the most trustworthy.
The first guard is out-of-sample testing: hold back a slice of history the tuning never touches, fit the rule on the rest, then test once on the untouched slice. A rule that survives data it has never seen is more believable than one measured on the data it was tuned to. The stronger version is walk-forward analysis, which rolls that split forward through time, tuning on one window and testing on the next unseen one, so the rule has to keep working as volatility regimes change rather than having worked once. For a short-volatility position this matters doubly, because the quiet market that rewards premium selling can turn without warning, and a rule tuned only on the quiet years has never met the move it most needs to survive.
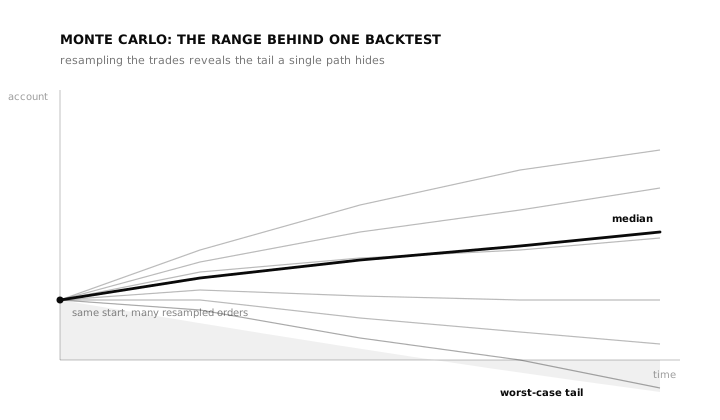
Figure 3: Monte Carlo resampling reorders the trades thousands of times to show the spread of outcomes one backtest could have produced. For a short straddle the tail, not the median, is the number that decides whether the rule is survivable. Illustrative figures.
The test that earns its keep most here is the Monte Carlo simulation, shown in Figure 3, which resamples or reorders the trade sequence thousands of times to reveal the range of outcomes the rule could have produced. A single backtest shows one path. A short straddle's real danger lives in the tail, the rare expiry where the index gaps through the stop and the open-ended loss arrives before the rule can react. Monte Carlo is what makes that tail visible, and a risk-of-ruin read on the same resampling shows how often a run of bad expiries would empty the account, before capital ever meets the question. The greeks underneath the position, the forces gathered as the option Greeks, move against a short straddle fastest exactly when it is already losing, so the validation has to stress the gap and the volatility spike, not only the calm days. Together these turn a backtest into strategy validation. Most configurations that look excellent on one quiet quarter do not survive it, and learning that on a screen is the cheapest lesson available.
A short straddle's real danger lives in the tail, the rare expiry where the index gaps through the stop and the open-ended loss arrives before the rule can react.Limits and pitfalls
The deepest limit is the structure, not the rule written on top of it. A short straddle's undefined risk means no amount of clever entry logic removes the open-ended tail; it can only manage how often the position is exposed to it. A stop offers no defence against a gap, the move that jumps from one price to another with no trade in between, because the fill happens past the level the stop named. The same forces that pay the seller, falling implied volatility and time decay, reverse violently when volatility spikes, so a single event can erase many quiet expiries of gains. SEBI's study of the derivatives segment found that 93% of individual F&O traders incurred losses between FY22 and FY24, with aggregate losses exceeding ₹1.8 lakh crore. That is context, not a verdict on any one rule, but it is the backdrop against which open-ended option selling should be judged. A short straddle is a reasonable hypothesis to test. It is not a verdict, and honest testing is what tells the two apart.
A checklist before you trust a short straddle strategy
Before you treat a steady stretch of premium collection as an edge, run the rule past a few honest questions.
| Checklist question | Why it matters |
|---|---|
| Did I define entry, stop, target, and time exit before testing? | Prevents discretionary hindsight |
| Are brokerage, charges, and slippage included on both legs? | Prevents fantasy returns |
| Have I stress-tested the worst plausible loss, and is the position size small enough to survive it? | Risk is undefined and the loss can far exceed the premium |
| Did the rule survive out-of-sample data? | Tests whether it generalises |
| Did walk-forward results stay stable across volatility regimes? | Tests parameter robustness |
| Did Monte Carlo show survivable tails and an acceptable risk of ruin? | Tests sequence risk |
| Did I stress the rule against a gap and a volatility spike, not calm expiries alone? | The whole risk is on the tail, and a stop offers no defence against a gap |
Frequently asked questions
What is a short straddle?
A short straddle sells one call and one put on the same underlying, the same strike, and the same expiry, usually at the money. It collects both premiums up front and profits if the underlying stays inside a narrow band while time decay and falling implied volatility erode the two options. The most it can make is the premium collected.
What is the maximum profit and maximum loss on a short straddle?
The maximum profit is limited to the total premium received, earned only if the underlying closes exactly at the strike at expiry. The maximum loss is undefined: it is theoretically unlimited on the upside as the underlying rises, and substantial on the downside as it falls toward zero. The loss can far exceed the premium collected.
What are the breakeven points of a short straddle?
There are two. The upper breakeven is the strike plus the total premium received, and the lower breakeven is the strike minus the total premium received. The position keeps something only while the underlying stays between the two; outside that band it loses.
Is a short straddle defined-risk or undefined-risk?
It is undefined-risk. Unlike an iron condor or a vertical spread, a short straddle has no cap on its worst case at the moment it is opened. It is short volatility and short gamma, so a sharp move or a volatility spike can cause a loss far larger than the premium collected. This article is educational and not advice to trade it.
How do you validate a short straddle strategy?
Test it net of all option costs on out-of-sample data the tuning never touched, roll that split forward with walk-forward analysis across different volatility regimes, and use Monte Carlo resampling to see the range of outcomes and the worst-case tail. Validation is what distinguishes a genuine edge from a rule fitted to a few calm expiries.
Is a backtested short straddle result a prediction of future returns?
No. A backtest describes how a rule behaved on historical data under stated assumptions. Past performance does not guarantee future results, and live conditions, option spreads, costs, gaps, and volatility regimes can differ sharply from the test.
The neatness of a short straddle, two premiums collected and time quietly doing the work, is exactly why it deserves the hardest testing rather than a screenshot of one calm quarter. A steady curve is a hypothesis until it survives data it has never seen, net of every cost on both legs, with its tail made visible. That survival is what daZh by Zudora is built to test: a no-code platform where an options rule like this can be specified with a visual leg configurator, backtested across history, then put through parameter optimisation, walk-forward analysis, overfitting detection, and Monte Carlo validation before any capital is committed. The goal is not a prettier backtest. It is an honest answer to whether an idea has earned the right to be traded.
Related guides
- Strangle strategy: build, backtest, and validate it
- Iron condor strategy: build, backtest, and validate it
- Supertrend straddle strategy: build, backtest, and validate it
- Implied volatility and the option Greeks
- Walk-forward analysis, out-of-sample testing, and Monte Carlo simulation
- Pillar: How to backtest an options strategy
Disclaimer: daZh is a software platform for building, testing, and managing user-defined trading strategies. It does not provide investment advice, stock recommendations, guaranteed returns, or profit assurance. Backtests are based on historical data and assumptions; actual trading results may differ.
Sources
- The Options Industry Council (OCC), "Short Straddle", options strategy reference (definition, leg structure, maximum profit, maximum loss, breakevens). https://www.optionseducation.org/strategies/all-strategies/short-straddle
- CFA Institute, "Backtesting and Simulation", CFA Program refresher reading, 2026 curriculum. https://www.cfainstitute.org/insights/professional-learning/refresher-readings/2026/backtesting-and-simulation
- Marcos Lopez de Prado, "Advances in Financial Machine Learning", Wiley, 2018 (backtest overfitting). https://www.wiley.com/en-us/Advances+in+Financial+Machine+Learning-p-9781119482086
- SEBI, "Updated study reveals 93% of individual traders incurred losses in equity F&O (FY22 to FY24); aggregate losses exceed ₹1.8 lakh crore", press release, September 23, 2024. https://www.sebi.gov.in/media-and-notifications/press-releases/sep-2024/updated-sebi-study-reveals-93-of-individual-traders-incurred-losses-in-equity-fando-between-fy22-and-fy24-aggregate-losses-exceed-1-8-lakh-crores-over-three-years_86906.html