
A backtest can show a genuine edge, a system that wins more than it loses across thousands of trades, and still hand a real trader a blown-up account. The gap between the two is rarely the entry signal. It is the size of each bet. Position sizing is the part of a trading system that decides how much of the account rides on any single trade. It is the lever that turns an edge on paper into capital that is still there a year later.
Definition
"Position sizing is the decision of how much capital, or how many units, to commit to a single trade, set from account size, the fraction of capital risked on the trade, and the distance to the exit that defines that risk."
The idea is simple to state and easy to underweight. A signal tells you which way to trade and when; position sizing tells you how much. Two traders can run the identical signal set, take the identical trades, and end a year in completely different places, because one risked a sliver of the account on each trade and the other risked a slab of it. The signals were the same. The sizing was not.
Position sizing is the part of a trading system that decides how much of the account rides on any single trade.What position sizing actually decides
Most of the attention a trader spends goes to entries: which instrument, which signal, when to get in. Van Tharp, the trading psychologist who put sizing at the centre of system design, argued this is backwards. In his book Trade Your Way to Financial Freedom he treats the entry as one of the least important parts of a system and the question of how much to risk, position sizing, as the part that most determines whether a trader reaches their objectives. He catalogues several models for answering it: a fixed number of units per fixed amount of capital, an equal-units model, a percent-risk model, and a percent-volatility model that scales size to how much an instrument moves. What they share is a shift of focus, from what to trade to how much.
Position sizing sits downstream of the edge and upstream of the outcome. A strategy's signals decide the direction of each trade; its sizing decides how much of the account is exposed to being wrong. The same edge, sized two different ways, can compound an account or quietly destroy it. Figure 1 makes the point with a single strategy run at three sizes: undersized, near the growth-optimal size, and oversized.
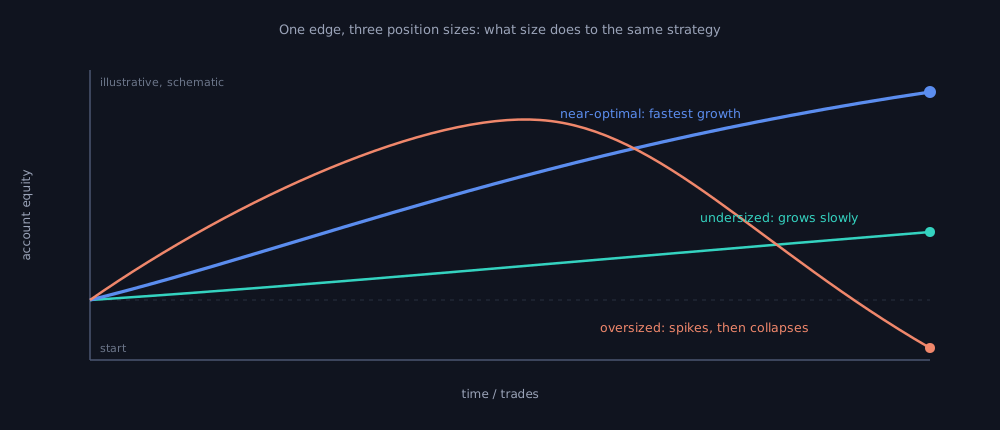
Figure 1: One edge, three sizes. The undersized run grows slowly, the near-optimal run grows fastest, and the oversized run climbs then collapses. Illustrative, schematic.
The same edge, sized two different ways, can compound an account or quietly destroy it.How position sizing is calculated
The most widely used method is the percent-risk model, also called fixed-fractional sizing. You do not choose the position size directly. You choose how much of the account you are willing to lose if the trade goes against you, then let that decide the size.
Capital at Risk = Account Equity × Risk Fraction per Trade

Position Size (units) = Capital at Risk ÷ Risk per Unit

Risk per Unit = | Entry Price − Stop Price |
Work it through with round numbers. Take an account of ₹10,00,000 and a rule to risk 1% of it, ₹10,000, on any one trade. If the plan is to buy at ₹2,000 and exit at ₹1,950, the risk per share is ₹50, so the position is ₹10,000 ÷ ₹50 = 200 shares, a holding worth ₹4,00,000. The capital at risk stays fixed at ₹10,000; the position size floats to match it. A tighter stop buys a larger position, a wider stop a smaller one.
| Stop distance (₹/share) | Shares to buy | Position value | Capital at risk |
|---|---|---|---|
| 25 | 400 | ₹8,00,000 | ₹10,000 |
| 50 | 200 | ₹4,00,000 | ₹10,000 |
| 100 | 100 | ₹2,00,000 | ₹10,000 |
| 200 | 50 | ₹1,00,000 | ₹10,000 |
Illustrative figures, computed from the percent-risk formula at a ₹10,00,000 account, 1% risk, and a ₹2,000 entry.
Figure 2 plots the same rule across those stop distances. Because the risk budget is held at ₹10,000, the number of shares is not a guess: it is whatever keeps the loss at the budget if the stop is hit. This is the quiet discipline of the model. The trader sets the loss they can accept, and the position size is derived, never the other way around.
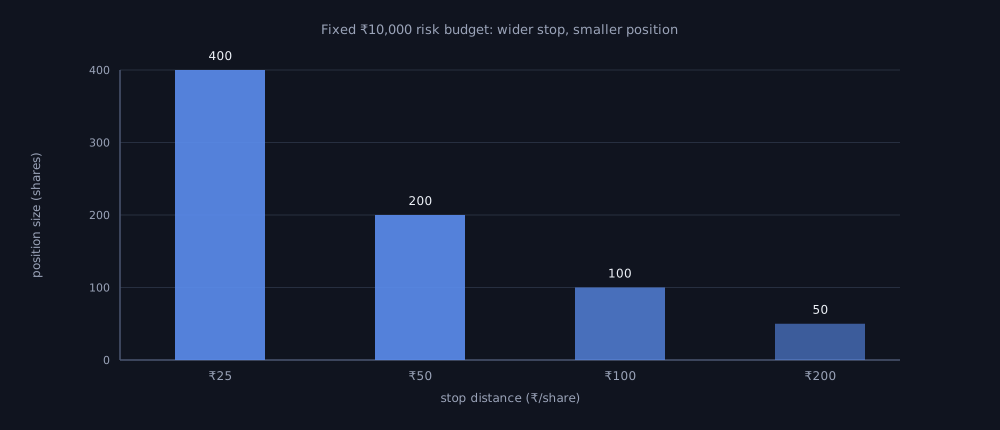
Figure 2: A fixed risk budget, four stop distances. The wider the stop, the smaller the position, so the loss stays the same if the stop is hit. Illustrative figures.
The Kelly criterion: sizing for growth
The percent-risk model answers how to keep a loss bounded. It does not answer what fraction is best. One formal answer comes from a 1956 paper by J. L. Kelly, Jr., a researcher at Bell Labs, published in the Bell System Technical Journal. Kelly was studying information sent over a noisy line, but the result described the betting fraction that makes capital grow at the maximum long-run rate.
Kelly Fraction (f*) = p − (q / b)

p = probability of a win
q = probability of a loss = 1 − p
b = payoff received on a win per unit risked
For a trading system the same formula is usually written with a win rate and a win/loss ratio. Edward Thorp, the mathematician who carried Kelly's result from blackjack to the stock market, gives the practitioner form as f* = W − ((1 − W) / R), where W is the win rate and R the ratio of the average win to the average loss. A system that wins 55% of the time, with average wins 1.5 times its average losses, gives f* = 0.55 − (0.45 / 1.5) = 0.25, a Kelly fraction of 25% of capital per trade.
That number is deliberately aggressive. Kelly maximises growth, not comfort, and 25% of an account on a single trade is far more than most traders could sit through. The reason almost nobody bets the full fraction is in the pitfalls below, but the formula is still useful: it sets the ceiling, the point past which more size starts to hurt rather than help.
How to read a position-sizing choice
A sizing rule is read through what it does to the account in a bad run, not a good one. The clearest test is a losing streak. Because each loss is taken on the equity that survived the last one, the risk fraction compounds downward, and small differences in size open into very different holes.
| Risk per trade | Equity after 10 straight losses | Drawdown |
|---|---|---|
| 1% | ₹9,04,382 | 9.6% |
| 2% | ₹8,17,073 | 18.3% |
| 5% | ₹5,98,737 | 40.1% |
| 10% | ₹3,48,678 | 65.1% |
Illustrative figures, computed from a ₹10,00,000 account and ten consecutive full-stop losses.
Figure 3 shows the gap. Risk 1% per trade and ten straight losses cost about 9.6% of the account, a drawdown most strategies recover from. Risk 10% and the same ten losses take roughly 65%, a hole that needs a near-tripling of what remains just to break even, and pushes the account toward the risk of ruin, the chance that losses end the account before its edge can play out. This is why a 1% to 2% risk-per-trade convention is common: it keeps the worst plausible streak inside a band a trader can survive and stay disciplined through.
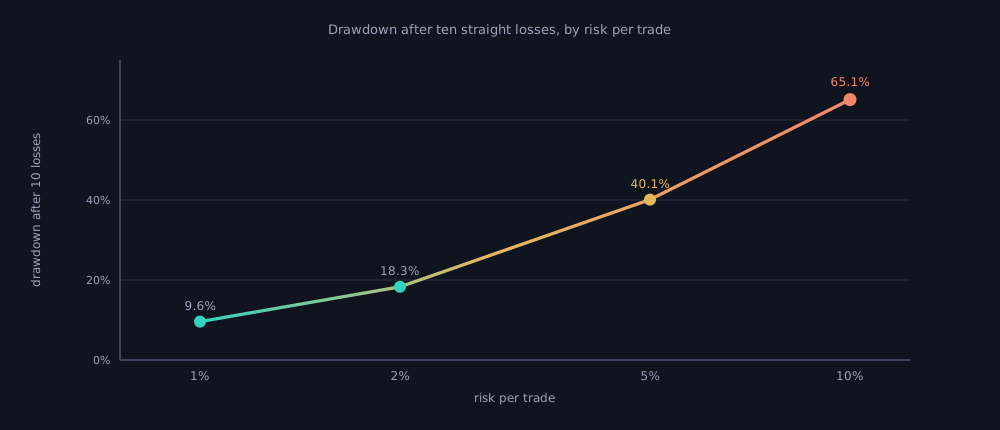
Figure 3: The same ten losses, four risk settings. The deeper the per-trade risk, the steeper the drawdown, and the curve turns dangerous well before the streak is unusual. Illustrative figures.
Position sizing is one expression of a wider risk-control vocabulary. The CFA Institute, in its reading on measuring and managing market risk, frames the same idea through position limits, risk budgeting, and stop-loss limits: position limits cap the market value of any one holding, risk budgeting allocates the total risk appetite across the book, and a stop-loss limit forces a reduction when a loss of a set size occurs. Sizing each trade is where those portfolio-level limits become a rule a single trade obeys.
Limits and pitfalls
The Kelly fraction is a ceiling, not a target, and treating it as a target is the classic mistake. Betting more than the Kelly fraction does not buy more growth, it buys more volatility and a higher chance of ruin. Past the optimal point the long-run growth rate falls even as the bets get larger, so an oversized winner and an oversized loser combine to grind capital down rather than build it. This is why many practitioners deliberately bet a fraction of Kelly, a half or a quarter, accepting slower growth in exchange for shallower drawdowns and a buffer against their own estimates being wrong.
Betting more than the Kelly fraction does not buy more growth, it buys more volatility and a higher chance of ruin.That estimation error is the second pitfall. Kelly's fraction is only as good as the win rate and payoff ratio fed into it, and both are estimates pulled from a backtest. If the real edge is smaller than the test suggested, the full-Kelly bet is already an over-bet. A win rate inflated by overfitting, or drawn from a flattering stretch of history, produces a position size that looks optimal and is reckless. Fractional Kelly and a hard percent-risk cap are both ways of buying insurance against inputs that were never as reliable as they appeared.
The third limit is quieter. Every percent-risk calculation assumes the stop holds at the level you set. A price that gaps straight through the stop, or slippage in a thin market, means the realised loss is larger than the ₹10,000 the model budgeted. Honest sizing leaves room for the stop to fail rather than assuming it never will. And the deeper point sits underneath all of this. Position sizing does not create an edge, it decides how much of one survives contact with a losing streak.
Position sizing does not create an edge, it decides how much of one survives contact with a losing streak.When the formula meets the market
A position size that is right on paper still has to clear a live order book, and several real-world constraints can move the number the formula returned. A sizing rule that ignores them is wrong in practice even when its arithmetic is correct.
| Constraint | Why it matters |
|---|---|
| Lot size | Futures and options trade in fixed lots, so the sized quantity has to round to whole lots, up or down, not the exact figure the formula returns. |
| Margin | A position can be sized correctly and still not be margin-feasible; the broker's margin requirement can cap what the account is allowed to hold. |
| Liquidity | A size that is small against the account can be large against the market, and forcing it through a thin book worsens slippage. |
| Gap risk | The stop that defines the risk may not fill at its level; a price that gaps through it makes the realised loss larger than the budget assumed. |
| Correlation | Five separately sized trades can be one bet if the instruments move together, so the risk live at once is larger than any single position shows. |
| Maximum exposure | Even when the risk-at-stop is small, the notional position value may need its own cap, so a tight stop never quietly justifies an outsized holding. |
These constraints do not replace the formula; they bound it. The percent-risk number sets the ceiling on the loss, and the constraints decide how much of that sized position the market will actually let you carry.
A checklist before you trust position sizing
Before trusting a sizing rule on live capital, ask:
- Is the size derived from a fixed risk budget and a real stop, not chosen by feel?
- What does the worst historical losing streak do to the account at this risk per trade?
- Is the per-trade risk capped at a level a long streak can survive, often 1 to 2 percent?
- If you are using Kelly, are you betting a fraction of it, not the full amount?
- Were the win rate and payoff ratio estimated honestly, out of sample, not from a flattering window?
- Does the rule leave room for a stop to gap or slip, so the real loss can exceed the budget?
- Does the worst-case drawdown from this sizing still sit inside what you can hold through?
A trading idea earns its returns only at a chosen size, and that choice is where a sound edge either compounds or quietly unwinds. Sizing each trade from a real risk budget, capping the worst plausible streak, and reading the drawdown that a given size implies before any money is committed is part of putting validation between a trading idea and live capital. That is the layer daZh by Zudora is built to be: a place to test an idea against history, see the drawdowns and worst runs a given sizing rule would have produced, and understand what a position-sizing choice does to risk before a rupee is at stake. A backtest cannot promise the next streak will be short. It can show you the one your sizing would have had to survive, while learning it is still cheap.
Frequently asked questions
What is position sizing in trading?
It is the rule that decides how much capital, or how many units, to commit to a single trade, set from account size, the fraction of capital risked, and the distance to the stop.
What is the 1% rule in trading?
A convention where a trader risks no more than 1% of account equity on any single trade, so that a normal run of losses stays survivable.
How do you calculate position size?
Divide the capital at risk by the risk per unit, the distance between the entry and the stop. At ₹10,000 of risk and a ₹50 stop, the position is 200 units.
Is position size the same as capital at risk?
No. Position value is the total exposure you hold; capital at risk is the expected loss if the stop is hit. You can hold ₹4,00,000 of shares while risking ₹10,000.
What is the Kelly criterion?
A formula for the growth-optimal fraction of capital to risk per bet, given the edge. It sets a ceiling on bet size and is usually applied cautiously.
Why do traders use fractional Kelly?
Because full Kelly is aggressive and very sensitive to estimation error, so betting a half or a quarter of it trades some growth for shallower drawdowns and a buffer against wrong inputs.
Related concepts
- Risk of ruin, the chance that a run of losses ends the account before its edge can play out.
- Drawdown, the peak-to-trough fall that position sizing is meant to keep survivable.
- Expectancy, the average outcome per trade that sizing then scales.
- A Framework for Systematic Trading.
Disclaimer: daZh is a software platform for building, testing, and managing user-defined trading strategies. It does not provide investment advice, stock recommendations, guaranteed returns, or profit assurance. Backtests are based on historical data and assumptions; actual trading results may differ.
Sources
- J. L. Kelly, Jr., "A New Interpretation of Information Rate", Bell System Technical Journal, 35(4), July 1956, pp. 917 to 926. DOI: 10.1002/j.1538-7305.1956.tb03809.x. https://onlinelibrary.wiley.com/doi/abs/10.1002/j.1538-7305.1956.tb03809.x
- Edward O. Thorp, "The Kelly Criterion in Blackjack, Sports Betting, and the Stock Market", Handbook of Asset and Liability Management, Vol. 1, North Holland, 2006, pp. 385 to 428. https://gwern.net/doc/statistics/decision/2006-thorp.pdf
- Van K. Tharp, "Trade Your Way to Financial Freedom", 2nd edition, McGraw-Hill, 2007 (position sizing models). https://vantharpinstitute.com/product/trade-your-way-to-financial-freedom/
- CFA Institute, "Measuring and Managing Market Risk", CFA Program refresher reading, 2026 curriculum (position limits, risk budgeting, stop-loss limits). https://www.cfainstitute.org/insights/professional-learning/refresher-readings/2026/measuring-managing-market-risk