
Two traders look at the same Nifty call option priced at ₹120. One calls it cheap, the other calls it expensive. The strike, the spot price, the days left to expiry, the interest rate: all of these sit in plain view, identical for both of them, so none of them can be the source of the argument. What they are really disagreeing about is how far the underlying is likely to travel before the option expires. Implied volatility is that disagreement written as a number. It is the volatility figure that, fed into an option pricing model, makes the model's price equal the price the option is actually trading at.
Definition
"Implied volatility is the volatility input that, when entered into an option pricing model, makes the model's theoretical price equal the option's observed market price."
Notice the direction of the arrow. A pricing model normally takes volatility as an input and produces a price as an output. Implied volatility runs that backward: it takes the market price as given and solves for the volatility that must have produced it. That is why it is called implied, the volatility is implied by the price rather than measured from history.
What implied volatility actually is
The idea sits on top of the option pricing model that Fischer Black and Myron Scholes published in 1973 in the Journal of Political Economy. Their formula prices a European option from a small set of inputs, and to derive it they assumed, among other "ideal conditions", that the variance rate of the return on the stock is constant. In the basic Black-Scholes setup, the visible inputs are the spot price of the underlying, the strike price, the time left to expiry, and the risk-free interest rate, with dividends handled separately in extended versions. The market option price is not an input to the forward pricing formula; it is the observed price the search sets as its target. The one unknown, the input that cannot be observed and the one traders solve for, is the volatility of the underlying over the option's life.
Because everything else is visible, the market price of an option is, in effect, a vote on that one missing number. In 1976 Henry Latané and Richard Rendleman, writing in the Journal of Finance, turned that observation into a method: of the variables the Black-Scholes model needs, all are directly observable except the standard deviation of returns from the underlying stock, so the volatility can be extracted from actual option prices instead of estimated from the past. They called it the implied standard deviation, and the name we use today, implied volatility, is the same idea.
Implied volatility is the one input the market cannot observe directly, so it is the one input traders solve for.Two things follow from this, and both matter. Implied volatility is the one input the market cannot observe directly, so it is the one input traders solve for. And because it is read out of the price traders are willing to pay right now, it is forward-looking: it reflects what the market expects volatility to be over the option's remaining life, not what volatility has already been. That is the sharp distinction from historical, or realised, volatility, which simply measures how much the underlying actually moved in the past. One is a record, the other is an expectation.
How implied volatility is calculated
There is no neat formula that spits out implied volatility on its own. The Black-Scholes equation maps volatility to a price in one direction, and it cannot be rearranged to map a price back to a single volatility in closed form. So implied volatility is found by search: a computer tries a volatility, prices the option, compares that to the market price, and adjusts, repeating until the model price and the market price agree.
Implied Volatility = the value of sigma that solves

      Model Price( S, K, T, r, sigma )  =  Market Price

where  S     = spot price of the underlying
       K     = strike price
       T     = time to expiry
       r     = risk-free interest rate
       sigma = volatility, the only unknown

Solved numerically: try a sigma, price the option,
compare to the market price, adjust, repeat to convergence.
A concrete version makes the loop visible. Suppose a one-month Nifty call is trading at ₹120. A trader feeds the spot, the strike, the time to expiry, and the interest rate into the model and guesses 12% volatility; the model returns ₹95, too low. They try 18%; the model returns ₹135, too high. They try 15.5%; the model returns ₹120, a match. The implied volatility of that option is 15.5%. Figure 1 shows this reversal of the usual flow: the same four visible inputs go in, but instead of solving forward to a price, the market price is fixed and the model is run backward to recover the volatility.
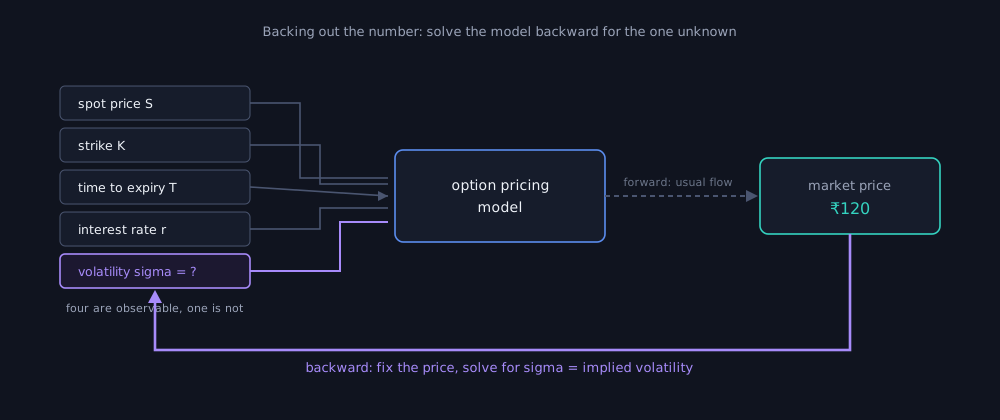
Figure 1: Backing out the number. A pricing model turns volatility into a price; implied volatility fixes the observed price and solves for the volatility that produced it.
The result is quoted as an annualised percentage. An implied volatility of 15% is commonly read as a roughly 15% one-standard-deviation annual move in the underlying under the model's return assumptions, which corresponds to about a two-in-three chance of staying within that band, not a guaranteed price range.
How to read an implied volatility number
A single implied volatility figure is annualised, so the first useful move is to scale it to the horizon you care about. Volatility grows with the square root of time, so a yearly figure is divided by the square root of the number of periods in a year to get a shorter one. An annual implied volatility of 18% corresponds to roughly 18% over a year, about 18% divided by the square root of twelve, or near 5.2%, over a month, and about 18% divided by the square root of 252 trading days, or near 1.1%, over a single day. Those are one-standard-deviation expected ranges, not predictions of direction.
The level on its own says little until you anchor it. The same 20% reading is high for a large, steady index and low for a thinly traded small-cap. This is why traders lean on implied volatility rank or percentile, which place today's reading against the same instrument's own recent history, rather than comparing raw numbers across very different underlyings. A reading in the 90th percentile means options are unusually expensive relative to how this underlying has been priced lately, whatever the absolute figure happens to be.
There is also a market-wide version of the same number. The NSE publishes a volatility index built on exactly this idea: it reads the order book of out-of-the-money near and next-month Nifty options and distils them into a single figure that, in the exchange's own words, depicts the expected market volatility over the next 30 calendar days, with higher values signalling higher expected volatility. It uses the methodology the Cboe introduced for its volatility index, which is designed to measure the market's expectation of 30-day forward looking volatility of the broad equity market as conveyed by index option prices. Both are implied volatility scaled up from a single option to the whole market.
Implied volatility is not a forecast the market promises to hit, it is a price the market is charging for uncertainty.The temptation is to read a high number as a prediction that a big move is coming. It is not. Implied volatility is not a forecast the market promises to hit, it is a price the market is charging for uncertainty. A high reading says options are expensive because demand for protection or exposure is strong, not that the underlying will definitely lurch.
| Implied volatility tells you | It does not tell you |
|---|---|
| What volatility the option price implies | The exact future move |
| How expensive options are relative to uncertainty | The direction of the move |
| The market's pricing of risk before expiry | Whether buying the option is profitable |
| Differences across strikes and expiries | One universal IV for the whole underlying |
| Event uncertainty priced into options | Whether realised volatility will match it |
The volatility smile, and why one number is never enough
The Black-Scholes model assumes volatility is a single constant for the underlying. The market disagrees with itself. If you back out implied volatility for several options on the same underlying with the same expiry but different strikes, you do not get one flat number, you get a curve. Options struck far from the current price, especially downside puts, usually carry higher implied volatility than options struck near the money. Plotted against the strike, the readings trace a U or a lopsided tilt, the shape known as the volatility smile, or the skew when it leans to one side.
| Strike, relative to spot | Option type | Implied volatility |
|---|---|---|
| 20% below spot | Put | 24% |
| 10% below spot | Put | 19% |
| At the money | Call or put | 15% |
| 10% above spot | Call | 16% |
| 20% above spot | Call | 18% |
Illustrative figures, not a real strategy or a recommendation.
The pattern is not a quirk; it is the market correcting the model. Real returns have fatter tails than the bell curve the formula assumes, and crashes fall harder and faster than rallies rise, so traders pay up for far-out-of-the-money puts and the implied volatility on those strikes rises to reflect it. Figure 2 plots the table above and shows the lopsided smile that results.
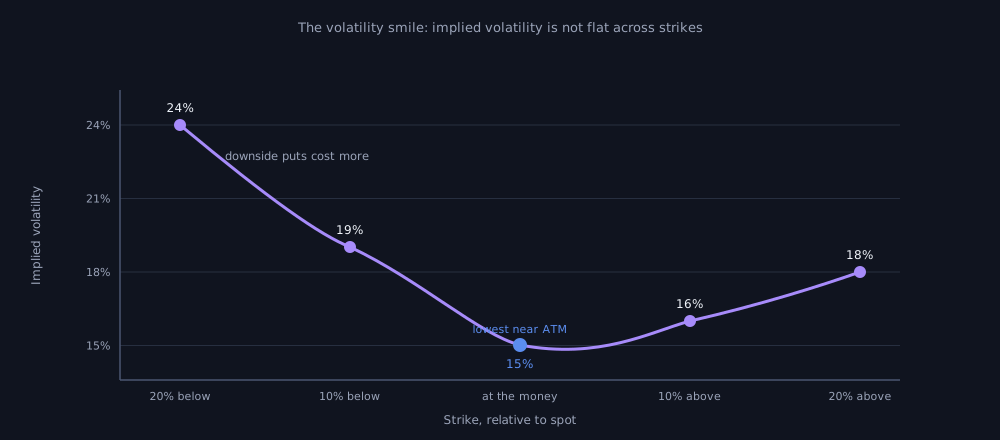
Figure 2: The volatility smile. Implied volatility read off options on the same underlying and expiry is not flat across strikes, it rises away from the at-the-money level, usually more steeply on the downside.
A single implied volatility number is an average the market never actually trades at.The practical lesson is that there is no one implied volatility for an underlying. There is a surface of them, varying by strike and by expiry. A single implied volatility number is an average the market never actually trades at. Quoting it without saying which strike and which expiry it came from is close to meaningless.
Limits and pitfalls
The most common trap is treating implied volatility as a durable property of the underlying. It is not. It moves, and it can move violently around scheduled events. Ahead of a result announcement, a policy decision, or an index rebalancing, uncertainty is high and option buyers bid prices up, so implied volatility climbs. The instant the event passes and the unknown becomes known, that uncertainty evaporates and implied volatility can fall sharply, a drop traders call an implied volatility crush.
| Timing around a scheduled event | Implied volatility | What is happening |
|---|---|---|
| 5 days before | 22% | Uncertainty building, options bid up |
| 1 day before | 38% | Peak, the unknown is fully priced |
| Day after | 17% | Crush, the uncertainty has resolved |
Illustrative figures, not a real strategy or a recommendation.
Figure 3 traces that arc. An option bought the day before such an event can lose value even when the underlying moves in the buyer's favour, because the volatility they paid for has drained out of the price. The direction was right and the position still lost.
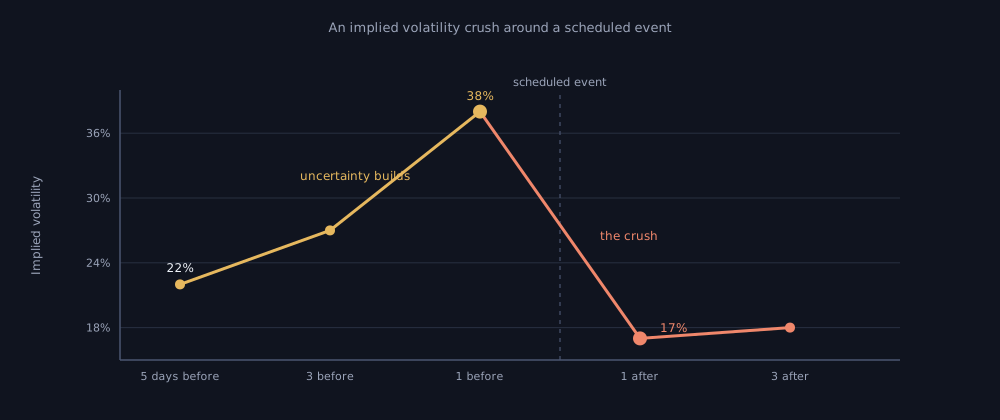
Figure 3: An implied volatility crush. Implied volatility builds ahead of a known event and can collapse once the event resolves, draining value from options held through it.
Two further cautions sit underneath. Implied volatility tends to revert toward its own long-run average, so an extreme reading is more often a temporary state than a new normal, and strategies that assume it will stay extreme tend to be disappointed. And the number itself is model-dependent: it is only as meaningful as the pricing model used to extract it, and the Black-Scholes assumption of a single constant volatility is exactly what the smile shows to be false. Change the model and the implied number changes with it.
Implied volatility tells you what the market expects, never what will happen.Implied volatility tells you what the market expects, never what will happen. It is a consensus price for uncertainty, and consensus is frequently wrong. Realised volatility, what the underlying actually does, can come in far above or far below what was implied, and the gap between the two is where a great deal of options trading lives.
A checklist before you trust implied volatility
Before reading an implied volatility figure as a fact, ask:
- Which strike and which expiry did this number come from, or is it an average across a surface?
- Is it being compared on its own scale, through rank or percentile, rather than against an unrelated underlying?
- Has it been scaled to the horizon that matters, not left as a raw annual figure?
- Is a scheduled event sitting inside the option's life that could collapse the number afterward?
- Is the reading near an extreme that is likely to revert rather than persist?
- Which pricing model produced it, and do that model's assumptions hold for this underlying?
- Are you reading it as the market's expectation, not as a promise of what will happen?
Implied volatility earns its place in a strategy only when it is tested against history rather than trusted on sight, and a backtest is where the assumptions behind it either hold or fail quietly. Building an options strategy that reads implied volatility, sizing a position against the expected move it implies, and then checking how that idea would have behaved across calm and stressed markets is part of putting validation between a trading idea and live capital. That is the layer daZh by Zudora is built to be: a place to express an idea that depends on implied volatility, test it over real history with its costs and assumptions made explicit, and understand what the number can and cannot tell you before any money is at stake. A metric cannot promise the next move. Reading it well means asking what the price is really saying before trusting it.
Frequently asked questions
What is implied volatility?
Implied volatility is the volatility figure that, fed into an option pricing model, makes the model's price equal the option's actual market price. It is read out of prices rather than measured from past data, and it is quoted as an annualised, forward-looking percentage.
What is the difference between implied and historical volatility?
Historical, or realised, volatility measures how much the underlying actually moved in the past, a record. Implied volatility is forward-looking, backed out of current option prices to reflect what the market expects the underlying to move over the option's remaining life.
How is implied volatility calculated?
There is no closed-form formula; the Black-Scholes equation maps volatility to a price but cannot be rearranged to recover volatility from a price. So it is found numerically: a computer tries a volatility, prices the option, compares it to the market price, and adjusts until the two agree.
What is an implied volatility crush?
An implied volatility crush is a sharp fall in implied volatility once a scheduled event resolves. Before a result or policy announcement uncertainty bids option prices up, and the instant the unknown becomes known that uncertainty drains away, so an option can lose value even when the underlying moved in the buyer's favour.
What is the volatility smile?
If you back out implied volatility for options on the same underlying and expiry across different strikes, you get a curve rather than one flat number. Options struck far from the current price, especially downside puts, usually carry higher implied volatility, tracing the U or tilt known as the smile or skew.
Does a high implied volatility reading mean a big move is coming?
Not necessarily. A high reading says options are expensive because demand for protection or exposure is strong, not that the underlying will definitely move; it reflects the market's expectation, not a promise of what will happen.
Related concepts
- Option greeks, the sensitivities that sit alongside implied volatility in an option's price.
- Slippage, the execution cost that erodes an options strategy in practice.
- Strategy validation, the process where a volatility-dependent idea is tested before it is trusted.
- How to Backtest an Options Strategy.
Disclaimer: daZh is a software platform for building, testing, and managing user-defined trading strategies. It does not provide investment advice, stock recommendations, guaranteed returns, or profit assurance. Backtests are based on historical data and assumptions; actual trading results may differ.
Sources
- Fischer Black and Myron Scholes, "The Pricing of Options and Corporate Liabilities", The Journal of Political Economy, 1973, 81(3): 637 to 654 (the ideal-conditions assumptions, including constant variance of return). https://www.sfu.ca/~kkasa/BlackScholes_73.pdf
- Henry A. Latané and Richard J. Rendleman, "Standard Deviations of Stock Price Ratios Implied in Option Prices", The Journal of Finance, 1976, 31(2): 369 to 381. DOI: 10.1111/j.1540-6261.1976.tb01892.x. https://onlinelibrary.wiley.com/doi/10.1111/j.1540-6261.1976.tb01892.x
- Cboe Global Markets, "Cboe Volatility Index Methodology" (the index objective: 30-day forward-looking expected volatility from index option prices). https://cdn.cboe.com/resources/indices/Volatility_Index_Methodology_Cboe_Volatility_Index.pdf
- National Stock Exchange (NSE), the NSE volatility index white paper and product page (expected market volatility over the next 30 calendar days, computed from the Nifty options order book using the Cboe methodology). https://www.nseindia.com/static/products-services/indices-indiavix-index