
A strategy can win more often than it loses, carry a real edge, and still drain an account to nothing. The reason is rarely the edge itself. It is the size of the bets placed on it: risk enough of the account on each trade, and a normal run of losses, the kind every honest backtest contains, arrives before the edge has the room it needs to compound. Risk of ruin is the number that measures exactly this danger. It is the probability that capital falls to a failure point, often zero or a level from which recovery is impractical, before a strategy's statistical edge can play out.
Definition
"Risk of ruin is the probability that a trader's capital falls to a predefined failure point, often zero or an unrecoverable level, before the strategy's statistical edge can play out."
The idea is older than markets. It descends from the gambler's ruin problem, a question Blaise Pascal posed to Pierre de Fermat in 1656 and that Christiaan Huygens published in 1657, with the general solution proved by Abraham de Moivre in 1711, as traced in a history of the problem by Song and Song in Communications for Statistical Applications and Methods. The canonical modern treatment is William Feller's An Introduction to Probability Theory and Its Applications. The gambler's question and the trader's are the same one: given an edge, a stake, and a bankroll, how likely is it that a losing streak empties the account before the edge can do its work.
A strategy can win more often than it loses, carry a real edge, and still drain an account to nothing.What risk of ruin really measures
Most performance metrics answer a profit question. Return, the Sharpe ratio, and expectancy all ask some version of "how much does this strategy make, and how efficiently." Risk of ruin asks a survival question, not a profit question. It does not care what the average outcome is. It cares about the worst path the account could take through a string of losing trades, and whether that path passes through a point of no return.
That distinction matters because averages hide tails. A strategy with a positive expectancy makes money on average, but "on average" is the destination, not the journey. The journey contains losing streaks, and a losing streak that arrives early, while the account is still small relative to the bets, can end the strategy before the average ever asserts itself. Risk of ruin is the probability that the journey kills the strategy before the destination is reached.
The failure point is a choice the trader makes, not a law of nature. It can be literal zero, but for most traders it is higher: a drawdown deep enough that the strategy is abandoned, the capital is withdrawn, or the position sizing can no longer be sustained. A 50% drawdown requires a 100% gain just to recover, and many traders stop long before that. Setting the ruin threshold honestly, at the level where you would actually walk away, is the first and most underrated input to the whole calculation.
How risk of ruin is calculated
The cleanest version comes straight from the gambler's ruin problem. Picture a sequence of even-money bets, each one winning a unit with probability p and losing a unit with probability q, where q equals one minus p. The account holds a whole number of these units. Against an opponent with unlimited capital, the probability of eventual ruin has a compact closed form.
Risk of Ruin  (gambler's ruin, even-money bets, edge present)

        R = (q / p) ^ c

  R = probability of eventual ruin
  p = probability of winning each bet (the win rate)
  q = probability of losing each bet = 1 − p
  c = capital, measured in equal bet-sized units

  Requires an edge (p > q). With no edge (p ≤ q),
  eventual ruin against an unbounded series is certain: R = 1.
This closed-form version is a clean teaching model for equal-sized bets. Real trading systems often resize as equity changes, so practical ruin is usually estimated to a drawdown threshold through simulation.
To see what the units mean in money, put the formula in rupee terms. The capital c is not the whole account; it is how many bet-sized risks sit between the account and its failure point.
| Input | Example |
|---|---|
| Account equity | ₹10,00,000 |
| Failure point | ₹5,00,000 |
| Capital that can be lost before ruin | ₹5,00,000 |
| Risk per trade | ₹25,000 |
| Bet-sized units before ruin (c) | 20 |
Illustrative figures.
If the strategy wins 55% of even-money bets, then R = (0.45 / 0.55) ^ 20, or about 1.8%. If the trader doubles the risk per trade to ₹50,000, the account holds only 10 bet-sized units before the same failure point, and the risk of ruin rises to about 13.4%.
Two features of this formula carry the whole intuition. First, an edge is necessary but not sufficient. If p is not greater than q, the base (q / p) is at least one, and raising it to any power leaves the risk of ruin at or above certainty: in this infinite-horizon model, a fair or losing game against an unbounded opponent ends in ruin no matter the bankroll. Second, when an edge does exist, the exponent c does the heavy lifting. Because the base is a fraction below one, risk of ruin falls exponentially as the account holds more bet-sized units. Figure 1 shows that decay for a strategy that wins 55% of even-money bets.
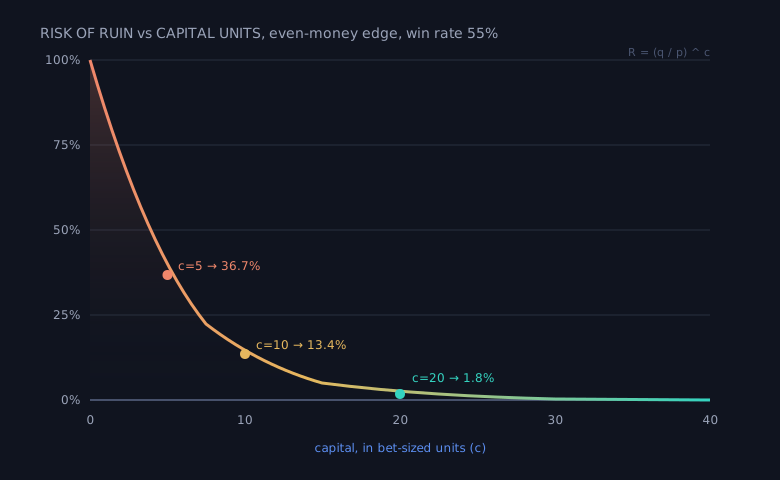
Figure 1: Risk of ruin against the number of bet-sized units the account holds, for an even-money edge of 55%, computed from R = (q/p)^c. Illustrative figures.
Real strategies do not bet even money: a winning trade and a losing trade are usually different sizes. The generalisation keeps the same shape but replaces the bare win rate with an edge that blends win rate and payoff ratio, the average win divided by the average loss. Ralph Vince's work on money management, in The Mathematics of Money Management, treats this trading-specific version, where the relevant quantity is the per-trade edge expressed as a fraction of the amount risked, and the exponent is the number of units of risk between the account and its ruin threshold. The lesson does not change: the strength of the edge sets the base, and the number of risk units sets the exponent.
To make the edge concrete, hold capital fixed at twenty bet-sized units and vary only the win rate of an even-money strategy.
| Win rate (even money) | Edge (p − q) | Risk of ruin at 20 units |
|---|---|---|
| 45% | −10% | 100% |
| 50% | 0% | 100% |
| 52% | 4% | 20.2% |
| 55% | 10% | 1.8% |
| 60% | 20% | 0.03% |
Illustrative figures, computed from R = (q/p)^c at c = 20.
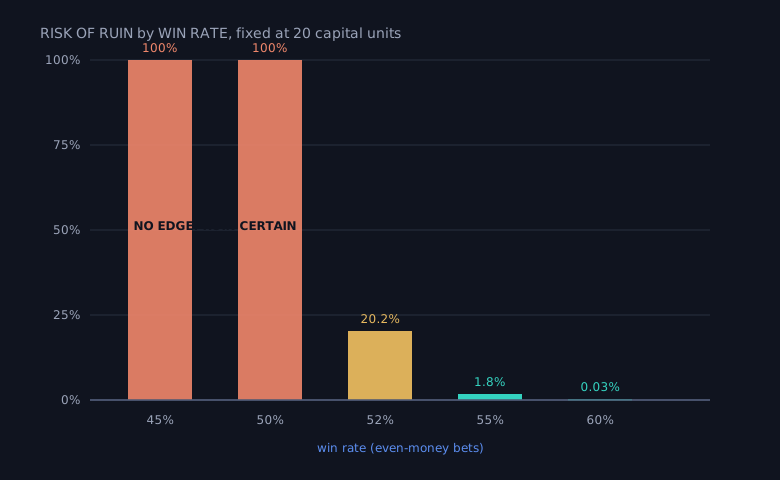
Figure 2: The edge cliff. Below a real edge, ruin is certain; just above it, a few points of win rate collapse the risk of ruin by orders of magnitude. Illustrative figures, computed from R = (q/p)^c at c = 20.
Figure 2 plots that edge cliff. The jump from 52% to 55% is the point worth sitting with. Three percentage points of win rate move risk of ruin from about one in five to under one in fifty. The edge does not change risk of ruin gently; near the break-even line it changes it like a cliff.
Risk of ruin asks a survival question, not a profit question.How to read it: the three levers
Risk of ruin is governed by three inputs a trader actually controls, and reading the number well means knowing which lever each problem calls for. The first is the edge, set by win rate and payoff ratio together. The second is the size of the bet, the fraction of capital risked per trade. The third is the bankroll measured in those bets, which is just the first two turned into the exponent c: a ₹10 lakh account risking ₹50,000 a trade holds twenty units, while the same account risking ₹1 lakh a trade holds only ten.
The edge is the hardest lever to move, because it is a property of the strategy and the market, not a setting. Bet size is the easiest, and it is the one most traders get wrong. With a genuine edge, the safest lever a trader controls is bet size. Halving the risk per trade does not halve the risk of ruin, it can shrink it by orders of magnitude. Hold the 55% even-money edge fixed and change only how much of the account rides on each trade.
| Risk per trade | Capital units (c) | Risk of ruin |
|---|---|---|
| 20% | 5 | 36.7% |
| 10% | 10 | 13.4% |
| 5% | 20 | 1.8% |
| 2% | 50 | 0.004% |
| 1% | 100 | ~0% |
Illustrative figures, win rate 55% even money, computed from R = (q/p)^c.
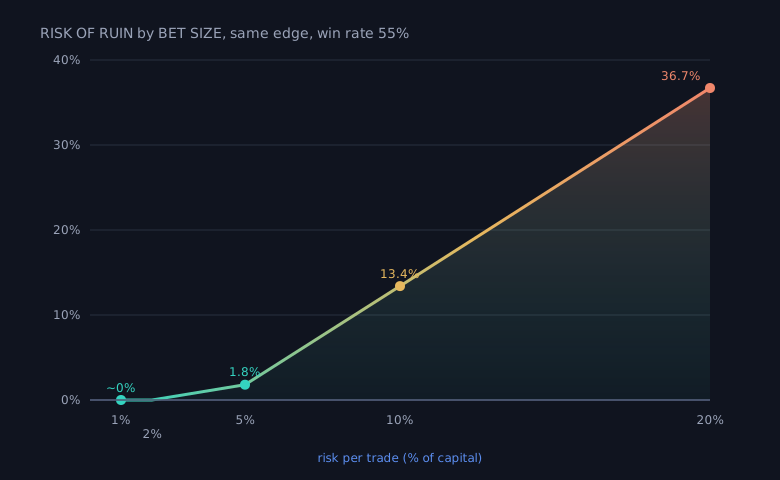
Figure 3: The same edge, different bet sizes. Risk of ruin stays negligible while bets are small and climbs steeply as the fraction risked per trade grows. Illustrative figures, win rate 55% even money, computed from R = (q/p)^c.
Figure 3 shows the same edge across bet sizes, and this is the same insight John Kelly reached from a different direction in 1956. Writing in the Bell System Technical Journal, Kelly derived the bet fraction that maximises the long-run growth rate of capital, and a central feature of that fraction is that it never bets the whole edge into a position large enough to court ruin. Betting more than the growth-optimal fraction does not just add risk, it eventually lowers long-run growth while raising the chance of ruin, the worst of both. The practical reading is that bet size is not a dial you turn up for more return without consequence. Past a point, turning it up costs you both growth and survival.
A subtler reading concerns how the number is estimated. The closed-form gambler's ruin assumes independent, identically sized bets, which real strategies violate: outcomes cluster, position sizes vary, and correlations bunch losses together. The CFA Institute's treatment of backtesting and simulation notes that standard backtesting can fail to capture the randomness in returns, particularly on the downside, which is why Monte Carlo and historical resampling map the distribution of outcomes rather than a single path. A Monte Carlo simulation that reshuffles a strategy's own trade history thousands of times gives a far more honest risk-of-ruin estimate than any tidy formula.
With a genuine edge, the safest lever a trader controls is bet size.Risk of ruin versus drawdown
Risk of ruin is easy to confuse with drawdown, but the two answer different questions. Drawdown measures how far an account has already fallen; risk of ruin estimates the probability of falling to a point you have defined as failure.
| Metric | What it asks |
|---|---|
| Drawdown | How far did the account fall from a previous peak? |
| Risk of ruin | What is the probability the account falls to a defined failure point? |
| Risk of ruin to zero | The probability of total depletion of the account. |
| Practical risk of ruin | The probability of hitting the drawdown at which the trader stops or the system becomes unusable. |
Where risk of ruin misleads
The number is only as trustworthy as the assumptions feeding it, and several of them fail quietly.
The first is the edge itself. Every risk-of-ruin figure assumes the win rate and payoff ratio are real and stable. If they came from an overfit backtest, the true edge is smaller than the measured one, and a base that looked safely below one may actually sit at or above it. Since the formula is exponential, a small error in the edge becomes a large error in risk of ruin. A strategy that reports a 0.03% chance of ruin on an inflated 60% win rate can carry a genuine, account-ending risk if the honest win rate is 52%.
The second is independence. The clean formula assumes each trade is independent of the last, but strategies that trade correlated instruments, or that scale into a position, take several losses at once when a regime turns. Bunched losses behave like one large bet, which quietly cuts the effective number of capital units and raises ruin above what the formula reports.
The third is the failure point. Risk of ruin to literal zero is almost always lower than risk of ruin to the level where a trader actually quits. A model that targets zero can show comfortable odds while the practical threshold, the drawdown at which the strategy is switched off, is breached far more often. The honest input is the level you would truly abandon, not the theoretical floor.
The last is what the number cannot say. Risk of ruin is a probability, not a promise. A 1% risk of ruin does not mean safety; it means roughly one account in a hundred, run under these exact assumptions, ends in ruin, and nothing rules out yours being that one. An edge only pays if the account is still alive to collect it. Risk of ruin describes the odds of staying alive, not a guarantee of it.
An edge only pays if the account is still alive to collect it.A checklist before you trust *risk of ruin*
Before trusting a risk-of-ruin figure, ask:
- Is the edge it assumes real and out-of-sample, or inflated by an overfit backtest?
- Is the failure point set at the level you would actually walk away, not just at zero?
- How many bet-sized units does the account really hold after fees, slippage, and gaps?
- Were the trade outcomes independent, or do correlation and scaling bunch the losses?
- Was it estimated from a closed-form formula, or from a simulation of the strategy's own history?
- Does the figure assume a fixed bet size, when live risk per trade may drift?
- Does it hold up across regimes, or only over the calm window it was measured on?
Risk of ruin earns its meaning only inside a test, where the edge, the bet size, and the failure point either hold or fail silently. Estimating it honestly, on an out-of-sample edge, with realistic costs, and through simulation rather than a single tidy path, is part of putting validation between a trading idea and live capital. That is the layer daZh by Zudora is built to be: a place to test an idea against history, size positions against the risk they carry, and see how survivable a strategy is before any money is committed. A metric cannot promise the next trade. Reading risk of ruin well means sizing bets so the edge has time to work, and treating a low number as a reason to stay careful, not to stop checking.
Frequently asked questions
What is risk of ruin in trading?
It is the probability that capital falls to a predefined failure point, often zero or an unrecoverable drawdown, before a strategy's statistical edge can play out. A profitable system can still reach that point if it is bet too aggressively.
What is the risk of ruin formula?
For even-money bets with an edge present, the gambler's ruin form is R = (q / p) ^ c, where p is the win rate, q is (1 − p), and c is the capital measured in equal bet-sized units. Trading versions blend win rate and payoff ratio into the edge.
How do you reduce risk of ruin?
Three levers move it: the size of the edge, the fraction of capital risked per trade, and the number of bet-sized units the account holds. With a genuine edge, shrinking the bet size lowers risk of ruin the fastest, often by orders of magnitude.
Can a profitable strategy still have a high risk of ruin?
Yes. Risk of ruin measures survival, not average profit, so a system with positive expectancy can still wipe out if an early losing streak arrives while the bets are large relative to the account.
Does a low risk of ruin guarantee safety?
No. Risk of ruin is a probability, not a promise: a 1% figure means roughly one account in a hundred, run under the same assumptions, still ends in ruin. The number is also only as trustworthy as the edge and independence assumptions feeding it.
How is risk of ruin best estimated?
The closed-form formula assumes independent, identically sized bets, which real strategies violate. A Monte Carlo simulation that reshuffles a strategy's own trade history many times gives a more honest estimate than a single tidy formula.
Related concepts
- Position sizing, the lever that turns an edge into a survivable strategy.
- Drawdown, the peak-to-trough fall that usually defines the failure point.
- Win rate and expectancy, the two halves of the edge that sets the base.
- A framework for systematic trading, where survival metrics are read before capital is risked.
Disclaimer: daZh is a software platform for building, testing, and managing user-defined trading strategies. It does not provide investment advice, stock recommendations, guaranteed returns, or profit assurance. Backtests are based on historical data and assumptions; actual trading results may differ.
Sources
- William Feller, "An Introduction to Probability Theory and Its Applications", Volume 1, 3rd edition, Wiley, 1968 (the canonical treatment of the gambler's ruin problem and the ruin probability R = (q/p)^c). https://www.wiley.com/en-us/An+Introduction+to+Probability+Theory+and+Its+Applications%2C+Volume+1%2C+3rd+Edition-p-9780471257080
- Sungchul Song and Jongwoo Song, "A Note on the History of the Gambler's Ruin Problem", Communications for Statistical Applications and Methods, 2013, 20(2): 157 to 168. https://koreascience.or.kr/article/JAKO201311637859390.page
- J. L. Kelly Jr., "A New Interpretation of Information Rate", The Bell System Technical Journal, 1956, 35(4): 917 to 926. DOI: 10.1002/j.1538-7305.1956.tb03809.x. https://onlinelibrary.wiley.com/doi/abs/10.1002/j.1538-7305.1956.tb03809.x
- Ralph Vince, "The Mathematics of Money Management: Risk Analysis Techniques for Traders", Wiley, 1992. https://www.wiley.com/en-us/The+Mathematics+of+Money+Management%3A+Risk+Analysis+Techniques+for+Traders-p-9780471547389
- CFA Institute, "Backtesting and Simulation", CFA Program refresher reading, 2026 curriculum. https://www.cfainstitute.org/insights/professional-learning/refresher-readings/2026/backtesting-and-simulation