
Open a one-minute chart of the Nifty future and you can stack half a dozen indicators on it in under a minute. A moving average for the trend, RSI for momentum, VWAP for the day's fair value, MACD underneath, maybe Supertrend flipping its colour and ADX measuring how strong the move is. The chart fills up fast. What it does not tell you is which of those lines, if any, would have made money once brokerage and slippage were paid. That is a separate question, and it is the one that matters.
This guide is a roundup of the best indicators for intraday trading, the tools traders reach for inside a single session, with a short build-backtest-validate note for each. The honest answer up front is simple. There is no universally best indicator. There are only different measurements. The useful skill is matching one to your idea and then proving the idea out. So the structure repeats for every indicator below: what it measures and where it came from, how to write it as a plain rule a no-code engine can run, how to backtest that rule with real costs, and last, the step most write-ups skip, how to validate it so a good-looking chart has to survive data it has never seen.
There is no universally best indicator. There are only different measurements.What the best indicators for intraday trading actually measure
The first mistake is treating indicators as interchangeable. They are not. Each one was built to answer a specific question, and stacking three that ask the same question gives you one opinion repeated, not three. Figure 1 sorts the common six by what they measure.
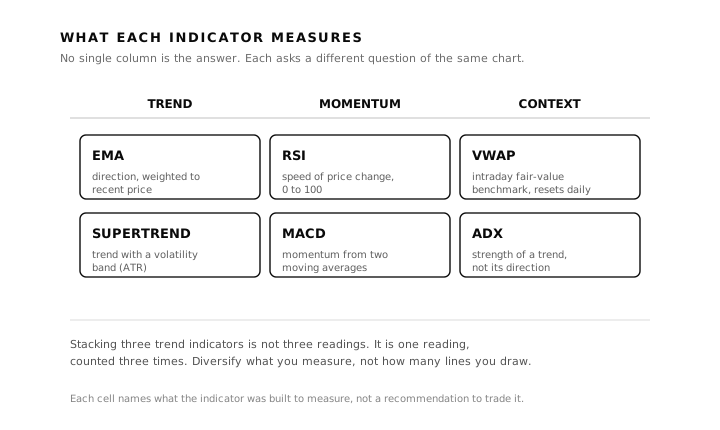
Figure 1: The common intraday indicators sorted by what each measures. No column is the answer; each asks a different question of the same chart. Illustrative grouping.
As a quick starting map, match the question your idea asks to the tool built for it, then test that rule.
| If your idea is about… | Start by testing… |
|---|---|
| Intraday fair value | VWAP |
| Trend direction | EMA or Supertrend |
| Momentum reversal | RSI |
| Momentum confirmation | MACD |
| Trend strength filter | ADX |
| Regime separation | ADX + trend rule |
Take them in turn, with their origins, because the origin tells you what the tool was designed to do.
The volume-weighted average price, or VWAP, is the average price of the day weighted by the volume traded at each level, resetting at the open. It was formalised by Stephen Berkowitz, Dennis Logue, and Eugene Noser in their 1988 Journal of Finance paper, "The Total Cost of Transactions on the NYSE", as a benchmark for judging execution quality, not as a forecast of price. It reads where the day's average buyer sits.
The exponential moving average, or EMA, smooths price but gives more weight to recent bars, so it turns faster than a simple average. StockCharts sets the weighting multiplier at 2 divided by the number of periods plus one. Common intraday lengths are 9, 21, and 50 bars. It reads trend direction.
The relative strength index, or RSI, is a momentum oscillator bounded between 0 and 100 that measures the speed and size of recent price changes. J. Welles Wilder introduced it in his 1978 book New Concepts in Technical Trading Systems, with a default 14-period setting and the now-standard 70 and 30 lines for overbought and oversold. It reads momentum.
The moving average convergence divergence, or MACD, was developed by Gerald Appel in the late 1970s. It subtracts a 26-period EMA from a 12-period EMA and plots a 9-period EMA of that difference as a signal line. It reads momentum through the gap between two trends.
Supertrend is a trend-following overlay that plots a line above or below price and flips sides when price crosses it. It is built on the average true range, a volatility measure Wilder introduced in the same 1978 book and which does not indicate direction, only volatility. The widely used default is a 10-period ATR with a multiplier of 3. It reads trend, with the noise filter set by volatility.
The average directional index, or ADX, is the odd one out. Also a Wilder creation from 1978, it measures the strength of a trend, not its direction, on a 14-period setting, with a common reading that values above 25 signal a trend and below 20 a range. It is best used to decide whether a directional rule should be active at all.
| Indicator | Measures | Standard setting | Originator |
|---|---|---|---|
| VWAP | Intraday fair value | Session reset | Berkowitz, Logue, Noser, 1988 |
| EMA | Trend direction | 9 / 21 / 50 | Weighted-average overlay |
| RSI | Momentum | 14, 70 / 30 | Wilder, 1978 |
| MACD | Momentum vs trend | 12 / 26 / 9 | Appel, late 1970s |
| Supertrend | Volatility-banded trend | ATR 10, mult. 3 | Built on Wilder's ATR, 1978 |
| ADX | Trend strength | 14, above 25 | Wilder, 1978 |
Building each one as a no-code rule set
An indicator is not a strategy. A strategy is an indicator plus an explicit entry rule, an exit rule, and stated settings. No discretion is left to the moment. Figure 2 shows the most common build, an EMA cross, marked on a single session.
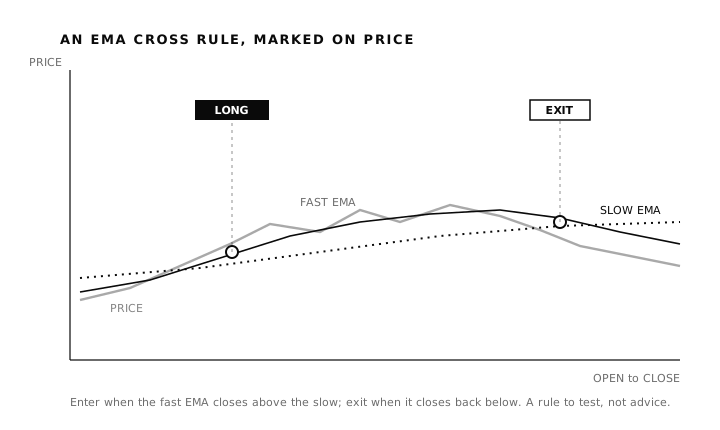
Figure 2: An EMA cross written as a rule. The fast line closing above the slow arms a long; a close back below closes it. A configuration to test, not advice. Illustrative figures.
Each indicator has a standard rule it is known for, and each comes with variants worth testing rather than adopting on faith. The table below states the canonical form for each. Read every entry as a hypothesis to evaluate, never as a recommendation to trade.
| Indicator | The standard rule to test | A parameter to sweep |
|---|---|---|
| VWAP | Long above the line, flat or short below | Confirmation bars |
| EMA | Long when the fast EMA crosses above the slow | The two lengths |
| RSI | Buy below 30, sell above 70, or trade the midline | Period and thresholds |
| MACD | Enter when the line crosses its signal line | The three lengths |
| Supertrend | Follow the flip: long when the line turns under price | ATR period, multiplier |
| ADX | Only allow a trend rule when ADX is above a threshold | The threshold level |
Two disciplines keep this honest. Define every term before you test it, so "oversold" becomes a measured RSI level on a stated timeframe and "cross" specifies how many bars of confirmation are required. And treat each setting as a dial to test across a range, not a number to trust because it once worked. Wilder's 14 and Appel's 12, 26, 9 were chosen for daily charts decades ago; whether they hold for a five-minute Bank Nifty future is an empirical question, not a given. A common and more defensible build pairs two of these, for example an EMA or Supertrend rule for direction gated by ADX for strength, so the strategy only trades when a trend is actually present.
An indicator is not a strategy. A strategy is an indicator plus an explicit entry rule, an exit rule, and stated settings.How to backtest the roundup
A backtest replays a fully specified rule against historical data and reports what it would have done. For intraday rules, the assumption that breaks most backtests is cost. These strategies trade often and inside the day, so each round trip pays brokerage, the securities transaction tax, exchange and regulatory charges, and goods and services tax, plus slippage, the gap between the price a rule wants and the price a market order actually fills at. A frequent intraday rule can hand its entire paper profit to costs without the gross curve ever hinting at trouble. A test that omits them measures an edge no account could capture.
Once costs are in, the headline return is the least useful number on the page. The metrics that decide whether a strategy is survivable are the uncomfortable ones. Maximum drawdown, the largest peak-to-trough fall in the account, tells you what you would have had to sit through. The Sharpe ratio, return earned per unit of volatility, says whether the return paid for its risk. Expectancy, the average profit or loss per trade after costs, says whether the rule has any edge once the bill is paid. The win rate means little on its own, because a rule can win most of its trades and still lose money if the losers are large. A trade-by-trade record lets you check the fills were realistic in the first place.
Every figure has to state its basis: the instrument, the period, whether returns are gross or net, and the slippage assumed. A backtest that does not say what it includes is not a result you can act on, and past performance of a backtest does not guarantee future behaviour.
How to validate it
This is the step that separates a strategy you can stand behind from one you have merely fitted, and a roundup of indicators makes the danger worse, not better. The more indicators and settings you have to choose from, the easier it is to keep trying combinations until one fits the past by luck, a failure mode called overfitting. Bailey, Borwein, López de Prado, and Zhu showed in "Pseudo-Mathematics and Financial Charlatanism" that the more configurations you test, the more likely the best one is luck dressed as skill. Sweeping six indicators across their parameter ranges until the equity curve looks clean is exactly that trap, at scale.
Validation is the discipline of making a rule prove itself on data it never saw. Figure 3 shows the core method, walk-forward analysis.
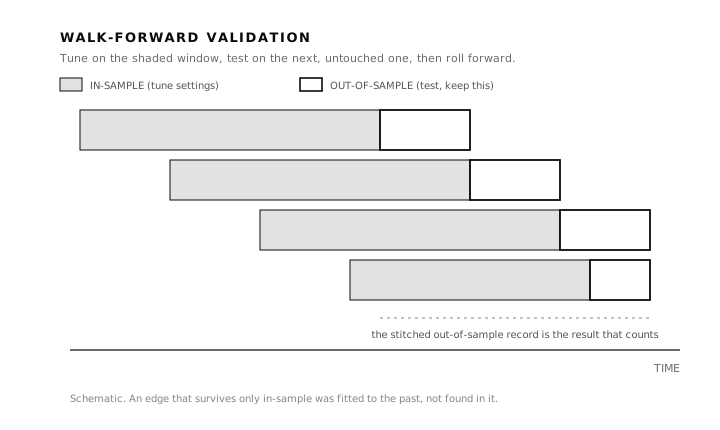
Figure 3: Walk-forward analysis. Settings are tuned on an in-sample window, tested on the next untouched one, and the windows roll forward; the stitched out-of-sample record is what counts. Illustrative figures.
Three checks do most of the work. The first is out-of-sample testing: hold back a slice of history the tuning never touches, and measure the rule there. If the edge evaporates on unseen data, it was never real. The second is walk-forward analysis, which automates that idea by repeatedly tuning on one window and testing on the next, so the rule has to survive changing conditions rather than one lucky regime. The third is Monte Carlo simulation, which resamples the order of trades many times to show the range of outcomes the rule could have produced, separating a robust result from one that depended on a single fortunate sequence. Together these turn a backtest into strategy validation.
The reason to bother is sobering and worth stating plainly. SEBI found that 93% of individual traders in equity futures and options incurred losses between FY22 and FY24, with aggregate losses exceeding ₹1.8 lakh crore. A strategy that survives validation is not a promise of profit. It has simply earned the right to be tried. A single flattering chart earns nothing of the sort.
A strategy that survives validation is not a promise of profit. It has simply earned the right to be tried.Limits and pitfalls
The first pitfall is the question itself. Asking for the single best indicator assumes one exists, and none does. Each indicator carries a known weakness. RSI and MACD are momentum tools that whipsaw in a range, firing signal after losing signal when price goes nowhere. EMA and Supertrend are trend tools that do the opposite, lagging and chopping when there is no trend to follow. VWAP is intraday by construction and says nothing across sessions. ADX measures strength but not direction, so it is a filter, not a trigger. The CFA Institute's framing is useful here: a backtest answers "how would this strategy have performed if it were implemented in the past", which is a question about one history, not a guarantee about the next.
The deeper pitfalls are not about any single indicator. Stacking correlated indicators is one: three trend lines agreeing is not confirmation, it is the same signal counted three times, which makes an overfit feel robust when it is not. Regime dependence is the second: a roundup tuned in a trending quarter can fail when the market turns choppy, because the indicators that suited one regime are wrong for the other. And the gap between a backtest and live trading is the last: even a validated rule meets real fills, latency, and liquidity for the first time only when capital is on the line, which is why paper trading sits between a validated strategy and a funded one.
A checklist before you trust an intraday indicator strategy
Before you put capital behind any of these indicators, run the rule you have built through the same honest questions, because the indicator you picked still has to earn its place in the regime you actually trade.
| Checklist question | Why it matters |
|---|---|
| Did I define entry and exit rules before testing? | Prevents discretionary hindsight |
| Are brokerage, charges, and slippage included? | Prevents fantasy returns |
| Were the indicator's settings and thresholds chosen before testing? | Reduces curve-fitting |
| Did the rule survive out-of-sample data? | Tests whether it generalises |
| Did walk-forward results stay stable? | Tests parameter robustness |
| Did Monte Carlo show survivable drawdowns? | Tests sequence risk |
| Did I confirm the indicator I chose suits the regime I trade, and that the rule held when that regime changed? | No indicator works across all conditions, so a trend tool in a range or a momentum tool in a strong trend will whipsaw unless validated for the regime in front of you |
Frequently asked questions
What are the best indicators for intraday trading?
There is no single best one. The indicators traders use inside a session each measure something different: VWAP reads the day's fair value, EMA reads trend, RSI and MACD read momentum, Supertrend reads volatility-banded trend, and ADX reads trend strength. The useful choice is the measurement your idea needs, then a backtest and validation of that specific rule.
How many indicators should an intraday strategy use?
Fewer than most charts show. Indicators that measure the same thing, such as several trend tools, give one reading repeated, not independent confirmation. A common approach pairs two that measure different things, for example a direction rule gated by a trend-strength filter, but any combination still has to be tested and validated rather than assumed.
Which indicator is best for a trending versus a ranging market?
Trend-following tools such as EMA crosses and Supertrend are built for trending conditions and tend to whipsaw in a range. Momentum oscillators such as RSI are often used for ranges and tend to fire false signals in a strong trend. ADX is sometimes used to tell the two regimes apart. Whether any of this holds for your instrument is an empirical question, not a rule.
What are the standard settings for these indicators?
The widely used starting points are RSI at 14 periods with 70 and 30 lines, MACD at 12, 26, 9, ADX at 14 with a 25 threshold, and Supertrend at a 10-period ATR with a multiplier of 3. Some come from the original indicator definitions, while others are widely used trading-platform conventions. They are starting points to test on your timeframe, not fixed answers.
Are these indicators profitable for intraday trading?
There is no honest yes or no. Whether a specific rule built on any of them has an edge depends on the instrument, the period, and the costs, and can only be answered by backtesting and validating that exact rule. A result that survives out-of-sample and walk-forward testing has evidence behind it; it is still not a guarantee.
Why validate an indicator strategy instead of just backtesting it?
A single backtest can look excellent purely because the settings were tuned to that stretch of history, a problem called overfitting that gets worse the more indicators you try. Out-of-sample testing, walk-forward analysis, and Monte Carlo simulation check whether the edge holds on data the tuning never saw, which is the difference between a fitted curve and a result with evidence behind it.
Where the value sits
The instinct to find the one best indicator is understandable, and it is the wrong instinct. A chart with six indicators is not six edges; it is six questions, most of which a given strategy does not need to ask. The work that turns an indicator into something tradable is the unglamorous part: matching the measurement to the idea, writing it as an explicit rule, charging it honest costs, and making it survive data it has never seen. That last part is the layer daZh by Zudora is built around, a no-code platform for building a strategy as explicit rules and then testing it in depth, with walk-forward and Monte Carlo validation, parameter optimisation, and analytics that surface risk before they surface return. The best indicator is not a line on a chart. It is the one whose rule you have actually tried to break, and could not.
Related guides
- EMA trading strategy: how to build, backtest, and validate it
- RSI trading strategy and MACD trading strategy
- Supertrend strategy, VWAP trading strategy, and ADX trading strategy
- Walk-forward analysis, out-of-sample testing, and overfitting
- A framework for systematic trading
Disclaimer: daZh is a software platform for building, testing, and managing user-defined trading strategies. It does not provide investment advice, stock recommendations, guaranteed returns, or profit assurance. Backtests are based on historical data and assumptions; actual trading results may differ.
Sources
- Stephen A. Berkowitz, Dennis E. Logue, Eugene A. Noser Jr., "The Total Cost of Transactions on the NYSE", The Journal of Finance, 43(1), March 1988 (introduces VWAP as an execution-quality benchmark). https://onlinelibrary.wiley.com/doi/10.1111/j.1540-6261.1988.tb02591.x
- J. Welles Wilder Jr., New Concepts in Technical Trading Systems, Trend Research, 1978 (the originating source for RSI, the Average True Range that Supertrend is built on, and the ADX, each introduced with a 14-period default).
- StockCharts ChartSchool, Technical Indicators and Overlays, orientation reference for formulas and widely used settings cited above. https://chartschool.stockcharts.com/table-of-contents/technical-indicators-and-overlays
- CFA Institute, "Backtesting and Simulation", CFA Program refresher reading, 2026 curriculum. https://www.cfainstitute.org/insights/professional-learning/refresher-readings/2026/backtesting-and-simulation
- David H. Bailey, Jonathan M. Borwein, Marcos López de Prado, Qiji Jim Zhu, "Pseudo-Mathematics and Financial Charlatanism: The Effects of Backtest Overfitting on Out-of-Sample Performance", Notices of the American Mathematical Society, 61(5), May 2014. https://papers.ssrn.com/sol3/papers.cfm?abstract_id=2308659
- SEBI, "Updated study reveals 93% of individual traders incurred losses in equity F&O between FY22 and FY24", press release, September 23, 2024. https://www.sebi.gov.in/media-and-notifications/press-releases/sep-2024/updated-sebi-study-reveals-93-of-individual-traders-incurred-losses-in-equity-fando-between-fy22-and-fy24-aggregate-losses-exceed-1-8-lakh-crores-over-three-years_86906.html