Watch a liquid futures contract on a quiet afternoon and one line on the chart seems to pull price toward it. The Nifty front-month future drifts up, stalls, slides back to a single moving level, and pushes off again. That line is the volume-weighted average price, or VWAP, the average price of every trade so far that day, weighted by how much volume traded at each price. Plenty of traders watch it. Far fewer have checked whether a VWAP strategy built off it actually works once costs are paid.
This guide walks through that check end to end: what VWAP is and what it was built to do, how to express a VWAP strategy as a plain set of rules a no-code engine can run, how to backtest it honestly with realistic costs and survivability metrics, and last, the part most write-ups skip, how to validate it so a rule that looked good on one slice of history has to prove itself on data it has never seen. The honest framing throughout is simple. A VWAP rule is a hypothesis, and most hypotheses do not survive testing.
A VWAP rule is a hypothesis, and most hypotheses do not survive testing.What VWAP is, and what it was built for
VWAP is the ratio of the total value traded to the total volume traded over a defined period, almost always a single trading session. Put plainly, it is the average price of the day, with each price counted in proportion to the volume that changed hands there. A price where lakhs of shares traded moves VWAP far more than a price touched by a handful of lots.
The calculation is cumulative and runs from the opening bell. For each interval you take a typical price, the high, low, and close averaged as (H + L + C) / 3, multiply it by the volume in that interval, keep a running sum of those products, and divide by the running sum of volume. StockCharts gives the formula as cumulative (volume times typical price) divided by cumulative volume. Because the running totals reset at the open and end at the close, VWAP is an intraday measure: it starts fresh every day and is not designed for multi-day analysis.
The origin matters, because it tells you what the tool was for. VWAP was formalised by Stephen Berkowitz, Dennis Logue, and Eugene Noser in their 1988 Journal of Finance paper, "The Total Cost of Transactions on the NYSE", where they proposed it as a benchmark for judging the quality of a broker's execution. A large institutional order filled at or better than the day's VWAP was filled well. The CFA Institute still teaches VWAP this way, as an intraday execution benchmark for managers who want to participate with volume rather than express a view on short-term direction. It was a yardstick for cost, not a forecast of price.
It was a yardstick for cost, not a forecast of price.That history is the first useful caution. Using VWAP as an entry signal repurposes a benchmark into a predictor: a reasonable idea to test, not a proven one to assume.
Building a VWAP strategy as a rule set
A strategy is only testable once it is fully specified, with no discretion left to the trader in the moment. Figure 1 shows the most common form, a cross rule, drawn on a single session.
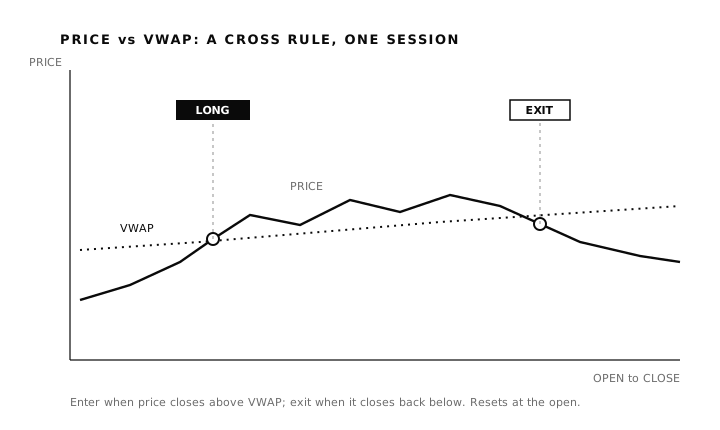
Figure 1: A VWAP cross rule on one session. Price closing above VWAP arms a long; a close back below closes it. The same logic inverts for shorts. Illustrative figures.
The standard configuration is the trend, or cross, version. The rule reads: when price closes above VWAP, treat the session bias as up and enter long; exit, or reverse, when price closes back below. VWAP here acts like an intraday moving average, a line that separates the part of the day buyers have controlled from the part sellers have. This above-and-below reading is a common interpretation of the indicator.
The second common form is the mean-reversion version, which uses VWAP the way its inventors framed it, as a fair-value anchor. Here a move far from VWAP is treated as stretched, and the rule fades it: sell when price runs well above VWAP, buy when it falls well below, expecting a pull back to the line. The two readings are opposites, which is exactly why neither can be assumed. One, both, or neither may hold for a given instrument and period, and only a test can say.
Around those two cores sit the variants worth testing rather than adopting on faith:
| Variant | The rule to test | Parameter to sweep |
|---|---|---|
| VWAP cross | Long above the line, flat or short below | Confirmation bars |
| VWAP reversion | Fade stretches back toward the line | Distance threshold |
| VWAP bands | Trade touches of a band set around VWAP | Band width |
| Anchored VWAP | Reset the anchor at an event, not the open | Anchor point |
| Session filter | Only trade certain hours | Time window |
Two design rules keep this honest. Define every term before you test it, so "well above" becomes a measured distance, often expressed in standard deviations as a VWAP band, and "closes above" specifies the timeframe and how many bars of confirmation are required. And treat each parameter as a dial to be tested across a range, not a number to be trusted because it worked once. Every rule is a configuration to evaluate, never a recommendation to trade.
Every rule is a configuration to evaluate, never a recommendation to trade.How to backtest it
A backtest replays the fully specified rule against historical data and reports what it would have done. The result is only as honest as its assumptions, and the assumption that breaks most VWAP backtests is cost. These strategies tend to trade often and intraday, so they pay brokerage, securities transaction tax, exchange and regulatory charges, and GST on every round trip, plus slippage, the gap between the price a rule wants and the fill a market order actually gets. A test that omits these measures an edge no account could ever capture. Figure 2 shows how far apart a gross curve and an after-costs curve can drift for an active rule.
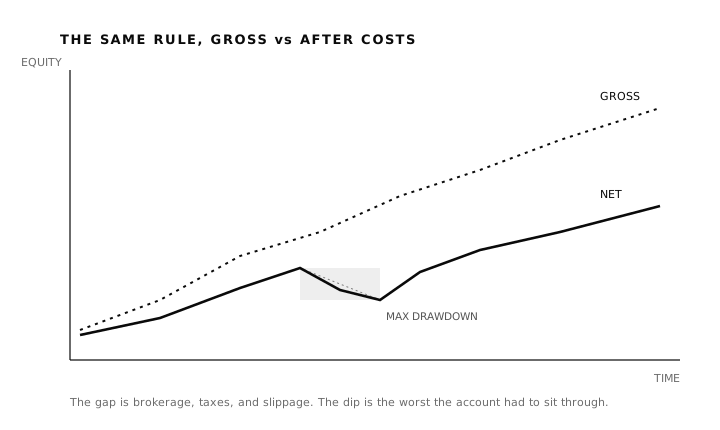
Figure 2: An equity curve, the account value over the test, shown gross and after costs. The shaded dip is the maximum drawdown, the worst peak-to-trough fall. Illustrative figures.
Once costs are in, the headline return is the least informative number on the page. The metrics that decide whether a strategy is survivable are the uncomfortable ones. Maximum drawdown, the largest peak-to-trough fall in the account, tells you what you would have had to sit through. The Sharpe ratio, return per unit of volatility, says whether the return paid for its risk. Expectancy, the average profit or loss per trade after costs, says whether the rule has any edge once the bill is paid. The win rate matters only alongside the average size of wins against losses, because a rule can be right most of the time and still lose money.
The basis of every figure has to be stated: the instrument, the period, whether returns are gross or net of costs, and the slippage assumed. A backtest result that does not say what it includes is not a result you can act on, and past performance of a backtest does not guarantee future behaviour.
How to validate it
This is the step that separates a strategy you can stand behind from one you have merely fitted, and it is the one most VWAP write-ups never reach. A single clean backtest, however good it looks, is not evidence. Test enough rules and parameter sets against the same stretch of history and one will fit its noise by chance, a failure mode called overfitting. Bailey, Borwein, López de Prado, and Zhu showed in "Pseudo-Mathematics and Financial Charlatanism" that the more configurations you try, the more likely the best one is luck dressed as skill. Sweeping VWAP band widths and confirmation bars until the curve looks clean is exactly that trap.
Validation is the discipline of making a rule prove itself on data it never saw. Figure 3 shows the core method, walk-forward analysis.
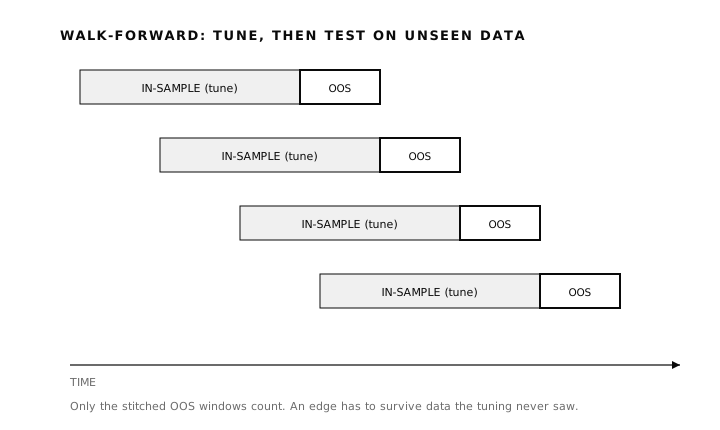
Figure 3: Walk-forward analysis. Parameters are tuned on an in-sample window, then tested on the next, untouched out-of-sample window, and the windows roll forward. Illustrative figures.
Three checks do most of the work. The first is out-of-sample testing: hold back a slice of history the tuning never touches, and measure the rule there. If the edge evaporates on unseen data, it was never real. The second is walk-forward analysis, which automates that idea by repeatedly tuning on one window and testing on the next, then stitching the out-of-sample results together, so the rule has to survive changing conditions rather than one lucky regime. The third is Monte Carlo simulation, which resamples the order and timing of trades thousands of times to show the range of outcomes the rule could have produced, separating a robust result from one that depended on a single fortunate sequence. Together these turn a backtest into strategy validation.
The reason to bother is sobering and worth stating plainly. SEBI found that 93% of individual traders in equity futures and options incurred losses between FY22 and FY24, with aggregate losses exceeding ₹1.8 lakh crore. A backtest that survives validation is not a promise of profit. It is something more modest. A strategy that has earned the right to be tried, rather than one trusted on a single flattering chart.
A strategy that has earned the right to be tried, rather than one trusted on a single flattering chart.A checklist before you trust a VWAP strategy
Before a VWAP rule earns any capital, walk it through the same honest questions that separate a tested hypothesis from a flattering chart.
| Checklist question | Why it matters |
|---|---|
| Did I define entry and exit rules before testing? | Prevents discretionary hindsight |
| Are brokerage, charges, and slippage included? | Prevents fantasy returns |
| Were the indicator's settings and thresholds chosen before testing? | Reduces curve-fitting |
| Did the rule survive out-of-sample data? | Tests whether it generalises |
| Did walk-forward results stay stable? | Tests parameter robustness |
| Did Monte Carlo show survivable drawdowns? | Tests sequence risk |
| Did I test only intraday, on liquid names, knowing VWAP resets each session? | Standard session VWAP resets each day, so it should be tested as an intraday measure; thin, low-volume instruments can make the line less reliable |
Frequently asked questions
What is a VWAP strategy?
A VWAP strategy is a set of trading rules built around the volume-weighted average price, the volume-weighted average of the day's prices. The two common forms are a trend version that trades crosses above and below the line, and a reversion version that fades moves far from it. Both are configurations to test, not advice.
How is VWAP calculated?
For each interval you take a typical price, the high, low, and close averaged, multiply it by that interval's volume, keep running totals of those products and of volume, and divide one by the other. The totals reset at the open, so VWAP is an intraday measure that starts fresh each session.
Is a VWAP strategy profitable?
There is no honest yes or no. Whether a specific VWAP rule has an edge depends on the instrument, the period, and the costs, and only backtesting and validating that exact rule can answer it. A result that survives out-of-sample and walk-forward testing has evidence behind it; it is still not a guarantee.
What timeframe works best for VWAP?
VWAP is an intraday indicator, so it is used within a single session, commonly on one, five, or fifteen minute bars. The right interval is itself a parameter to test, and the same rule can behave very differently across them.
What is anchored VWAP?
Anchored VWAP starts the cumulative calculation from a chosen event, such as an earnings release or a swing high, instead of from the day's open, so the average reflects activity since a meaningful point. The anchor itself becomes a parameter to test rather than assume.
Why validate a VWAP strategy instead of just backtesting it?
A single backtest can look excellent purely because the rule was tuned to that stretch of history, a problem called overfitting. Out-of-sample testing, walk-forward analysis, and Monte Carlo simulation check whether the edge holds on data the tuning never saw.
Where the value sits
A VWAP rule is easy to draw and easy to believe, which is exactly why it deserves a hard test. The chart that pulled price toward a single line all afternoon is a pattern worth investigating, not a setup worth funding on sight. The work that turns the one into the other is unglamorous: honest costs, metrics that lead with drawdown, and validation that makes a rule survive data it has never seen. That is the layer daZh by Zudora is built around, a no-code platform for building a strategy as explicit rules and then testing it in depth, with walk-forward and Monte Carlo validation, parameter optimisation, and analytics that surface risk before they surface return. A backtest that flatters an idea is cheap. One that tries honestly to break it is what tells you whether the idea has earned the right to trade.
Related guides
- RSI trading strategy: how to build, backtest, and validate it
- Moving average crossover strategy
- Best indicators for intraday trading
- Walk-forward analysis and out-of-sample testing
- A framework for systematic trading
Disclaimer: daZh is a software platform for building, testing, and managing user-defined trading strategies. It does not provide investment advice, stock recommendations, guaranteed returns, or profit assurance. Backtests are based on historical data and assumptions; actual trading results may differ.
Sources
- Stephen A. Berkowitz, Dennis E. Logue, Eugene A. Noser Jr., "The Total Cost of Transactions on the NYSE", The Journal of Finance, 43(1), March 1988 (introduces VWAP as an execution-quality benchmark). https://onlinelibrary.wiley.com/doi/10.1111/j.1540-6261.1988.tb02591.x
- CFA Institute, "Trade Strategy and Execution", CFA Program Level III refresher reading, 2026 curriculum (VWAP and TWAP as intraday execution benchmarks; implementation shortfall). https://www.cfainstitute.org/insights/professional-learning/refresher-readings/2026/trade-strategy-execution
- StockCharts ChartSchool, "Volume-Weighted Average Price (VWAP)" (calculation, daily reset, and the above-and-below interpretation). https://chartschool.stockcharts.com/table-of-contents/technical-indicators-and-overlays/technical-overlays/volume-weighted-average-price-vwap
- David H. Bailey, Jonathan M. Borwein, Marcos López de Prado, Qiji Jim Zhu, "Pseudo-Mathematics and Financial Charlatanism: The Effects of Backtest Overfitting on Out-of-Sample Performance", Notices of the American Mathematical Society, 61(5), May 2014. https://papers.ssrn.com/sol3/papers.cfm?abstract_id=2308659
- SEBI, "Updated study reveals 93% of individual traders incurred losses in equity F&O between FY22 and FY24", press release, September 23, 2024. https://www.sebi.gov.in/media-and-notifications/press-releases/sep-2024/updated-sebi-study-reveals-93-of-individual-traders-incurred-losses-in-equity-fando-between-fy22-and-fy24-aggregate-losses-exceed-1-8-lakh-crores-over-three-years_86906.html