On a five-minute Nifty chart, the appeal is obvious. The 9-period line tucks in tight against price, lifts up through the 21-period line, and a feed somewhere labels it a clean momentum entry. The exponential moving average looks alive in a way the slower simple average never does, hugging the last few bars and turning the moment the market does. What it does not come with is any evidence that trading those turns would have made money, net of costs, on the instrument in front of you.
That gap is what this guide works through. An EMA strategy is one of the most popular ways traders put a moving average to work, and its faster response is exactly why it is so easy to over-trust. The discipline that makes it useful is the same one that makes any indicator rule useful: take the idea, build it as a precise rule set, backtest it honestly, and then validate it hard enough to learn whether the edge is real or imagined.
The order matters. Build, then backtest, then validate. Skip the last step and one flattering backtest is all it takes to fund a setting that history never actually supported. The building takes minutes. The validation is where most EMA rules quietly fail. Finding that out on a screen is far cheaper than finding it out in the market.
The building takes minutes. The validation is where most EMA rules quietly fail.What an exponential moving average is
An exponential moving average weights recent prices more heavily than old ones. A simple moving average, or SMA, treats every day in its window the same: in a 20-day SMA each day counts for one-twentieth, or 5%. The exponential version refuses that even split, leaning on the latest bar and letting older bars fade.
The lever that does the leaning is the smoothing multiplier. As StockCharts ChartSchool sets it out, the multiplier is 2 divided by the number of periods plus one, so a 10-period EMA "applies an 18.18% weighting to the most recent price" and a 20-period EMA applies 9.52%. Each day's EMA is the latest price times that multiplier, plus the previous day's EMA times the rest, which means an EMA quietly carries every prior reading inside it. The weight on an old price shrinks each day but never reaches zero. Figure 1 shows the contrast.
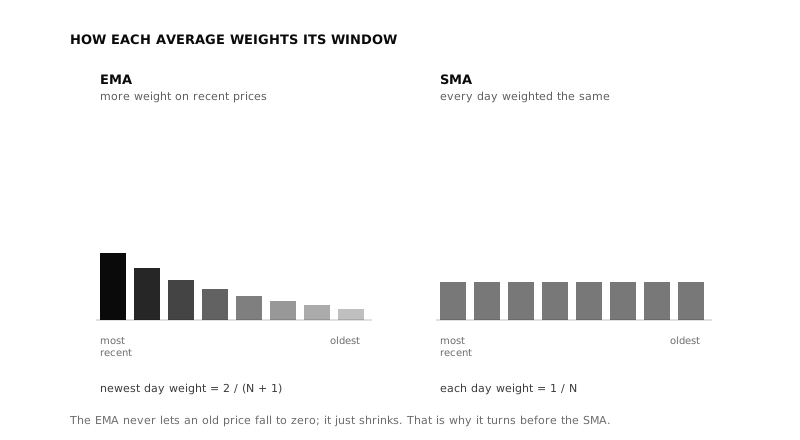
Figure 1: The two averages weight their windows differently. The EMA stacks weight on the most recent day and lets older days fade; the SMA gives every day the same share. That single choice is the whole difference. Illustrative figures.
The practical effect is responsiveness. StockCharts notes that exponential averages "have less lag and are, therefore, more sensitive to recent prices and recent price changes," and "will turn before simple moving averages." That speed is the whole reason a trader reaches for an EMA.
The idea itself is older than the charts. The exponential weighting at its core comes from exponential smoothing, a forecasting method first suggested by Robert Goodell Brown in 1956 and extended by Charles Holt in 1957, as documented in Everette Gardner's survey. Technical analysts later borrowed the same recursive formula to smooth price, and one trait carried over with it. An EMA, like any moving average, is what StockCharts calls a "trend-following, or lagging" indicator. It is faster than an SMA, but it still describes a move that has already begun rather than predicting one about to start.
It is faster than an SMA, but it still describes a move that has already begun rather than predicting one about to start.How to build an EMA strategy as a no-code rule set
An EMA becomes testable only when every word is turned into an exact condition. "Trade the EMA" is a sentence; a backtest needs a trigger. Two rule families dominate, and both are starting hypotheses to test, not advice to follow.
The first is a price-versus-EMA rule. Enter long when price closes above a chosen EMA, the 20 or the 50 being common, and exit when price closes back below it. Here the single line acts as a moving trend filter: above it, the rule treats the instrument as in an uptrend; below it, it stands aside or reverses.
The second is the EMA crossover, the rule the indicator is best known for. A fast EMA and a slow EMA are plotted together, and the cross is the signal. The most cited pairings are the 9 and the 21, and the 12 and the 26, the same lengths that sit inside the MACD indicator. The long rule reads as two conditions: enter when the fast EMA closes above the slow EMA, and exit when it closes back below. Figure 2 shows that crossover on a price series, with the faster line hugging price more tightly than an equal-weighted SMA would.
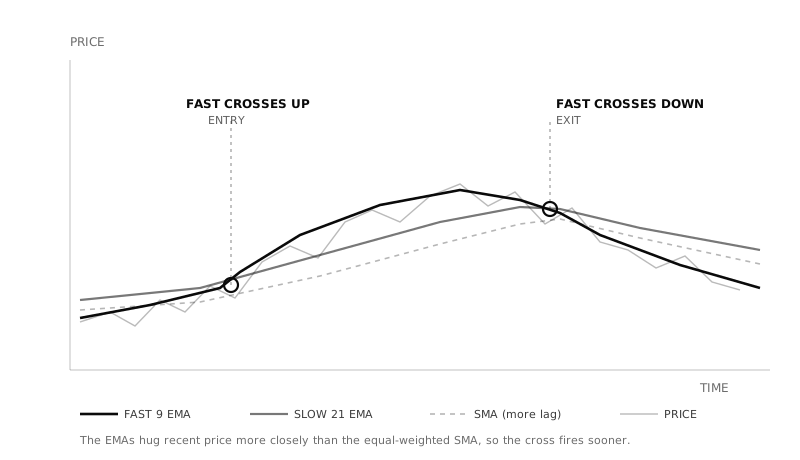
Figure 2: An EMA crossover. The fast 9 EMA crossing above the slow 21 EMA marks the entry; crossing back below marks the exit. Both EMAs track recent price more closely than the dashed SMA, so the cross fires sooner. Illustrative figures.
Even a clear rule needs its small print filled in. Must the cross hold on the closing price, so an intraday spike that reverses does not trigger a trade? Is shorting allowed, or does the rule simply move to cash? StockCharts' own three-line variant, the 5, 8, and 13 EMA crossover, goes long only when the 5 crosses above the 8 and both sit above the 13, a stricter filter than a single cross. Those choices change the result as much as the periods do, so they are part of the hypothesis, not a footnote to it.
The periods themselves are the most-argued setting, and there is no universally correct pair. The table below lists common configurations purely as starting points to test on your own instrument and timeframe.
| Configuration | Fast / slow | Typical use | Trade-off to test |
|---|---|---|---|
| Short-term momentum | 9 / 21 EMA | Intraday and swing entries | Fast, but more false signals |
| MACD lengths | 12 / 26 EMA | Trend and momentum | Middle ground, widely watched |
| Triple EMA | 5 / 8 / 13 EMA | Short-term trades | Stricter filter, later entries |
| Trend filter | 50 EMA, price cross | Position bias | Few signals, slow to flip |
| Long-term trend | 200 EMA, price cross | Regime context | Very slow, rarely triggers |
Illustrative configurations, not recommendations.
None of these is "the best." Each is a different bet about how much lag to trade away for how much noise. Only a backtest can tell you how each behaved on the market you care about.
Each is a different bet about how much lag to trade away for how much noise.How to backtest it
A backtest replays the finished rule across historical data and reports what it would have done. The trap is reading only the headline return. An EMA rule can post a healthy total return and still be unrunnable, because the same history hides how it got there.
The numbers that decide whether a rule is survivable are the uncomfortable ones. Maximum drawdown, the largest peak-to-trough fall in the account, tells you the worst stretch you would have had to sit through. The Sharpe ratio measures return per unit of risk. Win rate and expectancy, the average outcome per trade, separate a rule that wins often and small from one that wins rarely and large. Trade count matters too: a fast 9 / 21 cross on an intraday chart can fire dozens of times where a 50 EMA price-cross fires a handful.
Costs are not optional in that calculation. Every real trade pays brokerage, statutory charges, and slippage, the gap between the price you wanted and the price you got. Because the EMA's whole selling point is reacting sooner, an EMA rule tends to trade more than an SMA one, and a fast variant can hand its entire paper edge back to costs without the gross curve ever hinting at trouble. A backtest that does not charge the rule for trading is measuring an edge no one could capture.
The backtest's most useful service is exposing the EMA's structural weakness. In a trending market the rule gets in early and rides; in a sideways market the same sensitivity that makes it fast makes it twitchy, crossing up and down and bleeding small losses each time. StockCharts, writing about a fast exponential average, is blunt that its "rapid responsiveness can nevertheless lead to false signals in volatile markets." A backtest shows how large that bleed was on real history, not how large you hoped it would be.
How to validate it
A clean backtest is a starting point, not proof. This is the step that separates a rule worth running from one that only looked good, and it is the step most often skipped. The reason is uncomfortable: tune enough EMA lengths against the same stretch of history and one pairing will fit that history's noise, a trap called overfitting. Bailey, Borwein, López de Prado, and Zhu showed in "Pseudo-Mathematics and Financial Charlatanism" that the more configurations you try, the likelier the best-looking one is simply luck. An EMA invites exactly this, because its length is a free dial a trader can spin until the curve looks good.
Validation is the set of tests built to catch that. The first is out-of-sample testing: reserve a slice of history the tuning never touches, choose the lengths on the rest, and judge the rule only on the slice it has never seen. The second is walk-forward analysis, which rolls that choose-then-test window forward across the whole history, so the rule has to keep working through changing conditions rather than one lucky stretch. Figure 3 shows the shape.
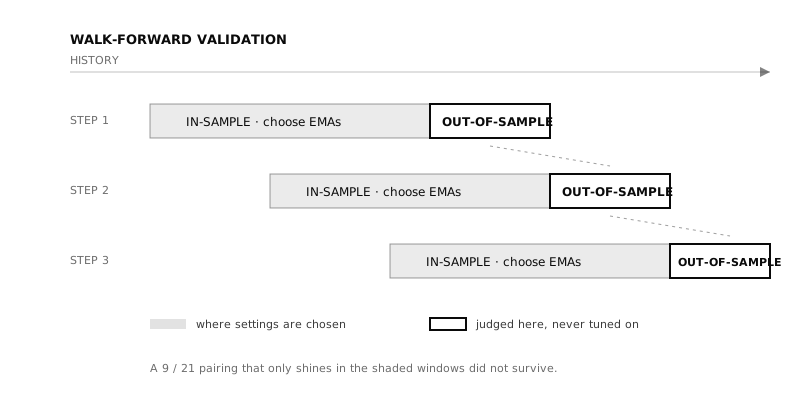
Figure 3: Walk-forward validation. The EMA lengths are chosen on each shaded in-sample window, then judged only on the out-of-sample window that follows, with the pair rolling forward each step. A 9 / 21 pairing that shines only in the shaded windows did not survive. Illustrative figures.
A third test, Monte Carlo simulation, resamples the order of the trades many times over to show how much of the result depended on a lucky sequence rather than a durable signal. Together these turn a single backtest into strategy validation. The CFA Institute frames the whole exercise as estimating "how would this strategy have performed if it were implemented in the past", with the honesty of the estimate resting on these guards. One good backtest answers the question once. Validation asks it again and again, on data the rule was never allowed to see. That is the only version of the answer worth trusting.
One good backtest answers the question once. Validation asks it again and again, on data the rule was never allowed to see.Limits and pitfalls
The EMA's weaknesses follow directly from its strength. It is faster than an SMA, but still a lagging rule by construction, entering after a move has begun and exiting after it has ended, surrendering the turns at both ends. Its sensitivity cuts both ways: the weighting that catches a real trend early also reacts to a one-bar spike that means nothing, so an EMA rule tends to whipsaw harder than a slower one in ranges.
Regime dependence is the deeper trap. An EMA rule earns its keep in trends and bleeds in ranges, so a backtest run over a period that happened to trend will flatter it, and the same settings may struggle when the market goes sideways. Parameter overfitting compounds the problem: nudging a 9 / 21 pair to 8 / 23 because it backtested a shade better is usually fitting noise, not finding an edge, and the EMA's continuous length dial makes that temptation constant. Costs scale with activity, so the faster the variant, the more of its paper return it pays away. None of this makes the EMA useless. It makes validation the difference between a rule you understand and one you only hope works.
A checklist before you trust an EMA strategy
Before an EMA rule earns live capital, walk it through the same questions that separate a tested edge from a flattering chart.
| Checklist question | Why it matters |
|---|---|
| Did I define entry and exit rules before testing? | Prevents discretionary hindsight |
| Are brokerage, charges, and slippage included? | Prevents fantasy returns |
| Were the indicator's settings and thresholds chosen before testing? | Reduces curve-fitting |
| Did the rule survive out-of-sample data? | Tests whether it generalises |
| Did walk-forward results stay stable? | Tests parameter robustness |
| Did Monte Carlo show survivable drawdowns? | Tests sequence risk |
| Did I check how the rule behaved in sideways, choppy markets rather than only trends? | The faster the EMA, the more it whipsaws and bleeds small losses in ranges |
Frequently asked questions
What is an EMA trading strategy?
A rule set built on the exponential moving average, a line that weights recent prices more heavily than old ones so it turns faster than a simple moving average. Common versions enter when price crosses a chosen EMA, or when a fast EMA crosses a slow one, such as the 9 and the 21.
What is the difference between an EMA and an SMA?
A simple moving average weights every day in its window equally. An EMA weights the most recent day most, using a multiplier of 2 divided by the period plus one, so a 10-period EMA puts about 18% of its weight on the latest price. That makes it react sooner, at the cost of more false signals.
What are the best EMA settings to use?
There is no universally best setting. The 9 / 21 and 12 / 26 crossovers are widely cited, with the 50 and 200 EMAs used as slower trend filters. The right lengths are the ones that survive out-of-sample and walk-forward testing on your instrument, not the ones that backtested best on a single stretch of history.
Does an EMA strategy work?
An EMA is a lagging, trend-following indicator, so a rule built on it tends to capture sustained trends and lose ground in sideways markets. Whether it has a tradable edge depends entirely on honest backtesting and validation, including realistic costs. Past performance does not guarantee future results, and no rule should be treated as assured.
Is the EMA better than the SMA for intraday trading?
The EMA reacts faster, which can help on short timeframes, but the same speed produces more whipsaws and more trades, which raises cost drag. Neither is universally better. The build-backtest-validate discipline, with honest fee modelling, tells you which behaves better on the instrument you actually trade.
How do you reduce false signals from an EMA?
Approaches to test include using slower lengths or a higher timeframe, requiring the cross to hold on a closing basis, stacking a third EMA as a filter, or confirming with a separate indicator. Each cuts false signals at the cost of entering later, itself a trade-off to validate rather than assume.
The EMA endures because it feels responsive: it sits close to price and turns when the market turns. That same responsiveness is why it is so easy to trust on sight and so rarely tested with the rigour it deserves. The discipline that makes it useful, building it precisely, backtesting it honestly, and validating it on data it never saw, is the same discipline that makes any indicator rule trustworthy. That validation layer between a trading idea and live capital is what daZh by Zudora is built around: no-code rule building, walk-forward and Monte Carlo validation, parameter optimisation, and analytics that lead with drawdown and risk rather than headline return. An EMA crossover is a hypothesis. daZh by Zudora is where you find out whether it survives being one.
Related guides
- Moving average crossover strategy
- MACD trading strategy
- VWAP trading strategy
- Best indicators for intraday trading
- Walk-forward analysis and out-of-sample testing
- Pillar: A framework for systematic trading
Disclaimer: daZh is a software platform for building, testing, and managing user-defined trading strategies. It does not provide investment advice, stock recommendations, guaranteed returns, or profit assurance. Backtests are based on historical data and assumptions; actual trading results may differ.
Sources
- StockCharts ChartSchool, "Moving Averages, Simple and Exponential" (EMA definition, the 2/(N+1) smoothing multiplier, 18.18% and 9.52% weightings, less lag and turns before the SMA, trend-following or lagging indicator). https://chartschool.stockcharts.com/table-of-contents/technical-indicators-and-overlays/technical-overlays/moving-averages-simple-and-exponential
- StockCharts ChartSchool, "Using the 5-8-13 EMA Crossover for Short-Term Trades" (the EMA crossover rule, the 5/8/13 filter, false signals in volatile markets). https://chartschool.stockcharts.com/table-of-contents/trading-strategies-and-models/trading-strategies/moving-average-trading-strategies/using-the-5-8-13-ema-crossover-for-short-term-trades
- Everette S. Gardner Jr., "Exponential Smoothing: The State of the Art, Part II", International Journal of Forecasting, 2006 (exponential smoothing first suggested by Robert Goodell Brown in 1956, extended by Charles Holt in 1957). https://www.bauer.uh.edu/gardner/docs/pdf/Exponential-Smoothing.pdf
- CFA Institute, "Backtesting and Simulation", CFA Program refresher reading, 2026 curriculum. https://www.cfainstitute.org/insights/professional-learning/refresher-readings/2026/backtesting-and-simulation
- David H. Bailey, Jonathan M. Borwein, Marcos López de Prado, Qiji Jim Zhu, "Pseudo-Mathematics and Financial Charlatanism: The Effects of Backtest Overfitting on Out-of-Sample Performance", Notices of the American Mathematical Society, 61(5), May 2014. https://papers.ssrn.com/sol3/papers.cfm?abstract_id=2308659