
On a chart, a MACD signal can look almost too clean. Two lines drift apart, snap back together, and cross, and right at that point the price turns. Mark a few of those crossings by hand and a pattern seems to leap off the screen: enter on the upward cross, exit on the downward one. The trouble starts the moment that observation becomes a MACD strategy you fund with real money.
That gap, between a crossover that looks predictive on a past chart and a rule that holds up on data it has never seen, is what this guide is about. MACD is one of the most recognised momentum indicators in technical analysis, and the crossover is the rule it is famous for. None of that makes a MACD strategy profitable. A crossover rule is a hypothesis about how a market behaves, and a hypothesis has to be tested before it earns capital.
So the work splits into three parts, and the order matters. First you build the rule precisely enough for a computer to follow it. Then you backtest it honestly, with costs and slippage, reading the result through risk rather than the headline return. Then, and this is the step most traders skip, you validate it on data the rule was never tuned on. Build, backtest, validate. The third step is where most good-looking MACD rules quietly fall apart.
A crossover rule is a hypothesis about how a market behaves, and a hypothesis has to be tested before it earns capital.What MACD measures, and how it is built
MACD stands for Moving Average Convergence Divergence, and it measures momentum by tracking the distance between two moving averages of price. MACD is widely credited to Gerald Appel, who introduced and popularised the indicator in the late 1970s and later wrote about it in his book on technical analysis. The idea is simple: when a faster average pulls away from a slower one, momentum is building; when they converge, momentum is fading.
The standard construction, written MACD(12,26,9), has three parts, defined the same way across reference sources such as StockCharts. The MACD line is the 12-period exponential moving average of closing price minus the 26-period exponential moving average. An exponential moving average, or EMA, is an average that weights recent prices more heavily than old ones. The signal line is a 9-period EMA of the MACD line itself, a smoother version that lags it slightly. The histogram, added by Thomas Aspray in 1986 in a series for Technical Analysis of Stocks and Commodities, is simply the MACD line minus the signal line, plotted as bars so the gap between the two is easy to read.
Those three parts give three commonly cited readings. A signal line crossover is the headline one: the MACD line crossing above the signal line is read as bullish, crossing below as bearish. A centreline crossover, where the MACD line moves through zero, marks the moment the 12-period EMA crosses the 26-period EMA. And divergence, where price makes a new high or low that the MACD line does not confirm, is read as momentum weakening. Figure 1 shows the signal line crossover that the rest of this guide treats as the example rule.
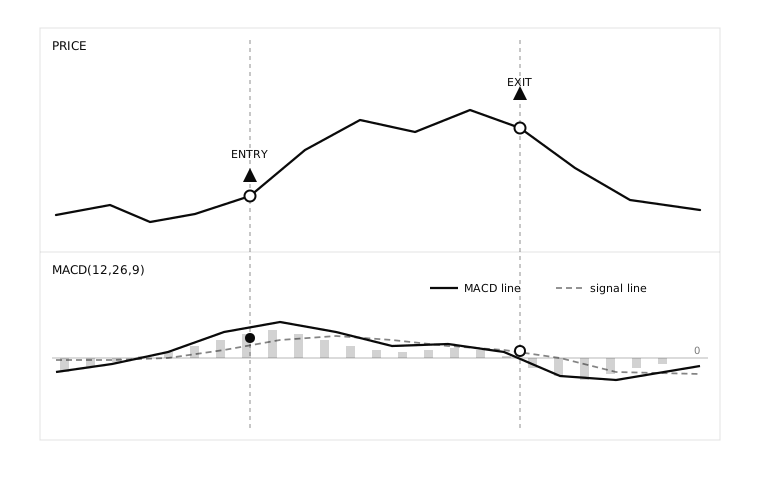
Figure 1: The classic MACD signal line crossover. The entry is marked where the MACD line crosses above the slower signal line, the exit where it crosses back below. Illustrative figures.
One property is worth stating plainly, because it shapes everything that follows. MACD is built from moving averages, so it is a lagging indicator: it confirms a move that has already begun rather than predicting one. That lag is the source of both its appeal and its main weakness, and it is exactly the kind of thing a backtest exists to measure.
Building the rule as a no-code strategy
A backtest needs a rule with no ambiguity left in it. "Buy when MACD crosses up" is an instinct; a strategy has to say which series, which timeframe, and what happens on entry, on exit, and when nothing triggers.
A plain version of the crossover rule, framed as a configuration to test and not as advice, looks like this. Enter long when the MACD line crosses above the signal line. Exit when it crosses back below. Use MACD(12,26,9) on a chosen timeframe, size each position by a fixed rule, and define what the strategy does between signals, which is usually nothing. Stated that tightly, the idea becomes something a no-code builder can express in a few rule blocks and a computer can run identically over years of history.
From there, the rule has variants. Each variant is a separate hypothesis to be tested rather than an upgrade to be assumed. A zero-line filter only takes the crossover when the MACD line is above zero, on the logic that it trades with the broader trend. A histogram variant acts when the bars start shrinking, trying to anticipate the cross Aspray designed the histogram to flag. The periods themselves are open: faster settings react sooner and whipsaw more, slower settings lag further but trade less. None of these is inherently better. They are different bets, and the only way to tell them apart is to test each one under the same honest conditions and compare what comes back.
Each variant is a separate hypothesis to be tested rather than an upgrade to be assumed.Backtesting the rule honestly
A backtest replays the rule over historical data and reports what it would have done, the question the CFA Institute frames as how a strategy would have performed had it been implemented in the past. The number it produces is only as honest as the assumptions behind it, and two assumptions decide most of the outcome.
The first is cost. Every real trade pays brokerage, statutory charges, and slippage, the gap between the price the rule wanted and the price it actually got. A crossover rule that trades often is especially exposed, because each round trip pays that toll. A backtest that assumes free, perfect fills measures an edge no account could capture. Figure 2 shows the shape of the problem: a gross curve and the lower net curve once costs and slippage are charged, with the distance between them being return the strategy never keeps.
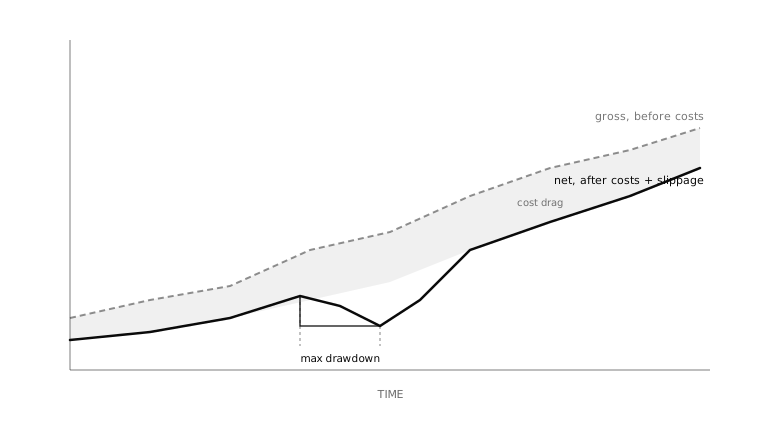
Figure 2: A backtest read honestly. The gap between the gross and net curves is cost drag, and the bracketed fall is the maximum drawdown, the largest peak-to-trough loss along the way. Illustrative figures.
The second is what you choose to look at. A single return figure hides the things that decide whether a strategy is survivable. The numbers that matter are the uncomfortable ones: the maximum drawdown, or worst peak-to-trough fall, which tells you the loss you would have had to sit through; a risk-adjusted measure such as the Sharpe ratio, which scales return by volatility so a smooth gain and a wild one are not treated alike; how often the rule traded, since trading frequency multiplies slippage; and the full trade-by-trade record, so you can see whether a few lucky trades carried the whole result. A MACD rule that looks strong on gross return can look ordinary once costs and drawdown are in the frame, and the ordinary version is the truthful one.
The step most traders skip: validation
Here is the part that separates a hypothesis from an edge, and the part most traders never reach. A clean backtest is not proof. Tune enough variants against the same stretch of history, more periods, a different filter, a tighter exit, and one of them will fit that history's noise rather than any durable behaviour. The trap is called overfitting, and Bailey, Borwein, López de Prado, and Zhu showed in "Pseudo-Mathematics and Financial Charlatanism" that the more configurations you try, the more likely the best one is simply the luckiest. A MACD rule polished until its backtest looks excellent is often a rule that has memorised the past.
Validation is the set of tests that fight this. The first is out-of-sample testing: hold back a slice of history the rule never sees while it is being built, then run the finished rule on that untouched slice. An edge that was real survives the move; an overfit one collapses. The second is walk-forward analysis, shown in Figure 3, which automates that discipline across the whole record: tune the parameters on a window, test on the next unseen window, then roll both windows forward and repeat. A rule that only works in the stretch it was fitted to gets exposed the moment it has to perform on data it never trained on.
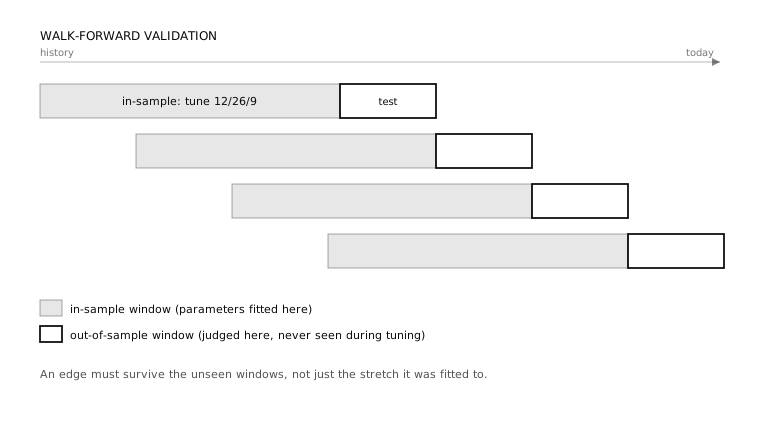
Figure 3: Walk-forward validation. Parameters are tuned on each in-sample window, then judged only on the out-of-sample window that follows, with the pair rolling forward through history. Illustrative figures.
The third is Monte Carlo simulation, which resamples the order and timing of the trades thousands of times to ask how much of the result was the particular path history happened to take. If most of those reshuffled paths look healthy, the edge is more believable; if the headline depended on a handful of trades landing in a lucky order, that shows up as a wide, ugly spread. Together these turn a single backtest into genuine strategy validation. Most over-tuned MACD rules do not make it through, and learning that on a screen is far cheaper than learning it in the market.
A MACD rule polished until its backtest looks excellent is often a rule that has memorised the past.What MACD cannot do
Even a validated MACD rule has known limits, and naming them is part of testing it honestly. The first is the lag built into the indicator. Because it is constructed from moving averages, MACD confirms a move after it has started, so by the time a crossover prints, part of the move can already be over.
The second is regime dependence. The crossover rule is a trend-following idea, and trend-following tools tend to struggle in sideways, range-bound markets, where the two lines cross back and forth and generate a string of small losing trades known as whipsaws. A backtest run only over a strongly trending period will flatter the rule; one that spans calm, choppy, and volatile regimes tells the fuller story. The third is parameter overfitting, already covered: the freedom to tune 12, 26, and 9 to anything is also the freedom to fool yourself, which is precisely why walk-forward testing matters. And the fourth is cost, which scales with how often the rule trades. An indicator does not know about brokerage or slippage; the backtest has to put them in.
None of this makes MACD useless. It makes MACD an indicator with a clear behaviour and clear failure modes, which is exactly what makes it worth testing properly rather than trusting on sight.
A checklist before you trust a MACD strategy
Before a MACD rule earns capital, walk it through the same honest questions this guide has been building toward.
| Checklist question | Why it matters |
|---|---|
| Did I define entry and exit rules before testing? | Prevents discretionary hindsight |
| Are brokerage, charges, and slippage included? | Prevents fantasy returns |
| Were the indicator's settings and thresholds chosen before testing? | Reduces curve-fitting |
| Did the rule survive out-of-sample data? | Tests whether it generalises |
| Did walk-forward results stay stable? | Tests parameter robustness |
| Did Monte Carlo show survivable drawdowns? | Tests sequence risk |
| Did I test across range-bound markets, not just trending ones? | MACD whipsaws when the lines cross back and forth in sideways conditions, so a trend-only test hides its worst losses |
Frequently asked questions
What is the MACD indicator?
MACD, or Moving Average Convergence Divergence, is a momentum indicator created by Gerald Appel in the late 1970s. It tracks the gap between a 12-period and a 26-period exponential moving average of price, plus a 9-period signal line and a histogram of the difference between them.
What are the standard MACD settings?
The default is MACD(12,26,9): a 12-period fast EMA, a 26-period slow EMA, and a 9-period signal line. Faster settings react sooner but whipsaw more, slower settings lag further but trade less. Each variant is a separate hypothesis to backtest, not an automatic improvement.
What is the most common MACD trading rule?
The signal line crossover: the MACD line crossing above the signal line is read as bullish and crossing below as bearish. Other readings include the centreline crossover through zero and divergence between price and the MACD line. Each is a rule to test, not advice.
Is a MACD strategy profitable?
There is no general answer, and any claim of assured returns should be treated as a red flag. A MACD rule is a hypothesis whose value depends on the market, the settings, costs, and risk. Only an honest backtest followed by out-of-sample and walk-forward validation can show whether a specific rule held up historically, and past performance does not guarantee future results.
What is the main weakness of MACD?
It is a lagging indicator built from moving averages, so it confirms moves after they begin and tends to whipsaw in sideways markets, generating clusters of small losing trades. Backtesting across trending and range-bound conditions is the way to measure that weakness rather than assume it away.
How do you validate a MACD strategy?
Beyond a single backtest, reserve an out-of-sample window the rule was never tuned on, run walk-forward analysis that re-tunes and re-tests as it rolls through history, and use Monte Carlo simulation to check how dependent the result was on luck. A rule that survives all three has far stronger evidence than one good-looking backtest.
The honest version of a MACD strategy is the one that has been built precisely, charged for its costs, read through its drawdown, and tested on data it never saw. That is the layer daZh by Zudora is built around: a no-code platform where a rule like a MACD crossover can be expressed visually, optimised across parameters, and then put through out-of-sample, walk-forward, and Monte Carlo validation, with analytics that lead with risk rather than the headline return. The point is not to promise the next trade. It is to tell you, as honestly as software can, whether an idea has earned the right to be tried.
Related guides
- RSI trading strategy: build, backtest, validate
- Moving average crossover strategy
- EMA trading strategy
- Best indicators for intraday trading
- Walk-forward analysis and out-of-sample testing
- A framework for systematic trading
Disclaimer: daZh is a software platform for building, testing, and managing user-defined trading strategies. It does not provide investment advice, stock recommendations, guaranteed returns, or profit assurance. Backtests are based on historical data and assumptions; actual trading results may differ.
Sources
- Gerald Appel, "Technical Analysis: Power Tools for Active Investors", FT Press, 2005 (originator of MACD; indicator construction and interpretation). https://www.oreilly.com/library/view/technical-analysis-power/0131479024/
- StockCharts ChartSchool, "MACD (Moving Average Convergence/Divergence) Oscillator" (MACD line, signal line, histogram formulas; crossover, centreline, and divergence rules). https://chartschool.stockcharts.com/table-of-contents/technical-indicators-and-overlays/technical-indicators/macd-moving-average-convergence-divergence-oscillator
- Thomas Aspray, "MACD Momentum", Technical Analysis of Stocks and Commodities, Vol. 6 No. 8, 1986 (introduction of the MACD histogram). https://store.traders.com/-v06-c08-macd-pdf.html
- CFA Institute, "Backtesting and Simulation", CFA Program refresher reading, 2026 curriculum. https://www.cfainstitute.org/insights/professional-learning/refresher-readings/2026/backtesting-and-simulation
- David H. Bailey, Jonathan M. Borwein, Marcos López de Prado, Qiji Jim Zhu, "Pseudo-Mathematics and Financial Charlatanism: The Effects of Backtest Overfitting on Out-of-Sample Performance", Notices of the American Mathematical Society, 61(5), May 2014. https://papers.ssrn.com/sol3/papers.cfm?abstract_id=2308659