
Every trade begins with a price in mind. The screen shows a level, a rule says to act, and the order goes out expecting that level. Slippage is the difference between that expected price and the one the market actually hands back. Most of the time the gap is small. Sometimes it is the whole reason a strategy that looked profitable on paper loses money in the account.
Definition
"Slippage is the difference between the price a trade is expected to fill at and the price it actually fills at."
Formally, slippage is the difference between the execution price a trader expects, usually the one the trading software shows, and the price at which the transaction actually happens. The CFA Institute curriculum frames the same idea as the gap between the price at the moment a trade is decided and the price at which it is finally filled, captured by the implementation shortfall measure of total trading cost. Slippage can fall in the trader's favour or against, but for strategies that demand immediate execution it often behaves like a cost, because urgency forces the trader to accept the price the market is offering.
The reason it matters is that slippage is the cost that is easiest to forget and hardest to recover. A backtest can assume the price you wanted was the price you got. The market makes no such assumption. The gap between those two worlds is where an edge measured on history can fail to survive contact with real execution.
Slippage is the difference between that expected price and the one the market actually hands back.What causes slippage
Slippage is not random noise. It comes from the structure of how orders meet the market, and a handful of forces drive most of it.
Thin liquidity is the first. An order fills against whatever is resting in the order book at each price level. When there is not enough size at the price you wanted, the order walks up or down the book to find the next available level, and the average fill ends up worse than the quote. A standard orientation reference on the term lists liquidity, market impact, and frictional cost, the small recurring drag that trading itself imposes, as the contributors, and in a thin market all three bite harder.
Speed is the second. When price is moving fast, the level on the screen is already stale by the time an order reaches the exchange. A rapid move during that brief delay can place the fill on the wrong side of the swing. The faster the market, the wider the gap between the price that triggered the decision and the price that clears.
The faster the market, the wider the gap between the price that triggered the decision and the price that clears.Order size relative to the book matters just as much. A large order consumes the liquidity available at the best price and reaches for the next, an effect the CFA Institute curriculum calls market impact, the adverse price impact caused by trading an order, and one of the largest costs in trading. This impact grows in a concave, roughly square-root way with order size relative to available volume, a pattern that empirical work has confirmed even in option markets, where the square-root impact law was shown to hold on a large set of real trades: the bigger the trade against the available depth, the more the fill price moves against it.
Delay closes the list, the time between deciding to trade and the order reaching the market. André Perold, who coined the framing in 1988, separated the paper portfolio, which transacts at the price at the moment of decision, from the real portfolio, which does not. The CFA Institute breaks the resulting cost into delay, execution, and opportunity components, and every one of them is a way the realized price drifts from the intended one.
Taken together, the main causes and who they hit hardest:
| Cause | What happens | Who is most affected |
|---|---|---|
| Thin liquidity | The order walks through the book to find size | Small-caps, options, far-OTM contracts |
| Fast market | The quote changes before the order reaches the exchange | Breakout, news, and event-driven systems |
| Large order size | The order's own size moves the price | High-capital or low-volume strategies |
| Delay | The signal price and the execution price drift apart | API-based or manual execution |
| Market orders | Fill certainty is bought with price uncertainty | Urgent entries and exits |
Why slippage erodes a paper edge
Slippage is dangerous precisely because it hides during testing. A backtest replays history, and the simplest version assumes each trade fills at the exact price the rule named. That assumption is comfortable and wrong. Perold's whole point was that the price on paper and the price in reality are different numbers, and the difference, the implementation shortfall, is the standard for measuring the total cost of the trade.
Figure 1 shows the gap in its simplest form. A rule intends to trade at one price. The realized fill lands a little worse, and the distance between them is slippage. One trade barely registers. The problem is that the gap repeats on every trade, in the same adverse direction, and it compounds.
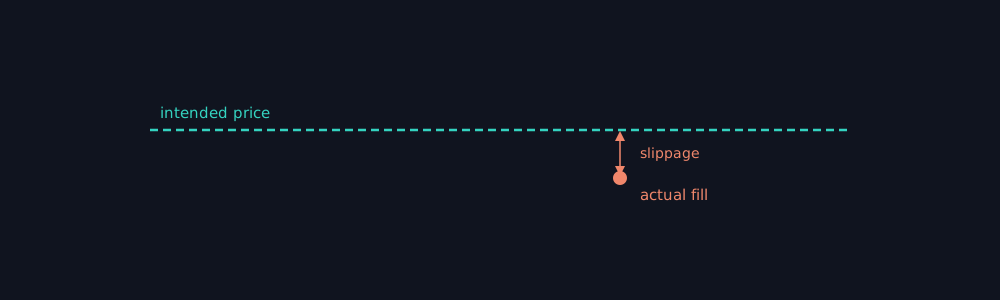
Figure 1: The intended price versus the realized fill. The gap between them, repeated on every trade, is slippage.
Put numbers on it. If a strategy expects to capture ₹2 a trade but loses ₹0.60 to slippage on entry and another ₹0.60 on exit, more than half the expected edge is gone before brokerage and taxes are even counted.
The same arithmetic across a range of slippage levels shows how little it takes.
| Expected edge per trade | Entry slippage | Exit slippage | Edge after slippage |
|---|---|---|---|
| ₹2.00 | ₹0.20 | ₹0.20 | ₹1.60 |
| ₹2.00 | ₹0.60 | ₹0.60 | ₹0.80 |
| ₹2.00 | ₹1.00 | ₹1.00 | ₹0.00 |
| ₹2.00 | ₹1.20 | ₹1.20 | -₹0.40 |
Illustrative figures.
A strategy does not need large slippage to fail. If the expected edge per trade is small, even a few paise or ticks on entry and exit can erase the entire advantage, and a little more turns the edge into a loss.
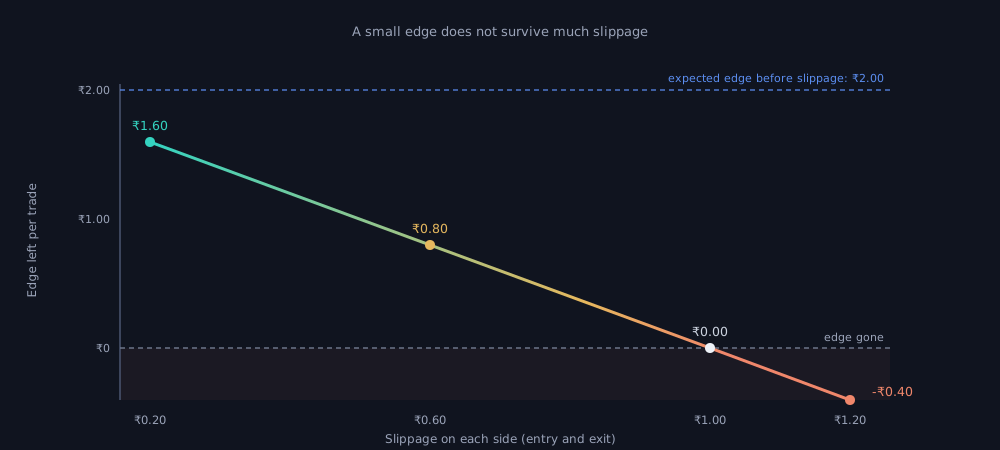
Figure 2: A small edge does not survive much slippage. Every ₹0.20 added to the slippage on each side takes ₹0.40 off the edge; by the time slippage reaches ₹1.00 a side, the entire ₹2.00 edge is gone.
A high-frequency strategy is the clearest case. If a system trades hundreds of times and each fill loses a fraction to slippage, the drag can swallow an edge that looked decisive on paper. Costs scale with activity, and the more a strategy trades, the more it must overcome before the first rupee of profit. SEBI's study of the equity derivatives segment found individual traders paid roughly ₹50,000 crore in transaction costs between FY22 and FY24, a reminder that the friction of trading is large and real, not a rounding error.
The problem is that the gap repeats on every trade, in the same adverse direction, and it compounds.This is why an edge can be both genuine and unprofitable at once. A signal may be real and may have called direction correctly across years of data, yet if the assumed fills were better than the market would ever have given, the backtest measured an edge no live trader could have captured. The same trap shows up alongside overfitting and hindsight bias when you backtest an options strategy: all three flatter the past and mislead about the future.
How a serious backtest accounts for it
A test that ignores slippage answers a question no live trader faces. A serious one builds the gap in deliberately, so the result reflects fills the market could plausibly have given rather than the ones the rule wished for.
The honest approach starts by not assuming the touch price. Instead of filling at the exact level a signal named, a careful backtest applies a slippage assumption, a modelled cost on every fill, and stresses it. If an edge survives only at zero slippage and collapses once a realistic gap is added, that edge existed only in the optimistic fill, not in the market. The assumption should also scale with the conditions that drive slippage: wider for thin instruments, faster markets, and larger orders relative to the book.
The difference between a flattering backtest and a trustworthy one is mostly a list of assumptions.
| Assumption | Naive backtest | Serious backtest |
|---|---|---|
| Entry price | The signal price | The signal price plus slippage |
| Exit price | The target or stop price | A realistic fill after spread and slippage |
| Costs | Brokerage only | Brokerage, taxes, slippage, and impact |
| Liquidity | Assumed infinite | Checked against volume and depth |
| Result | A cleaner equity curve | A more realistic test of deployability |
The limit of any backtest is that it still cannot reproduce live execution exactly, because your own order was never in the historical book. That is the gap a forward test is meant to close. Running a strategy in real time, even without real money, surfaces fills and delays a replay cannot, which is part of why paper trading and backtesting answer different questions. Slippage is where the two most often diverge: a simulated order can fill where a live one would have missed.
None of this makes slippage disappear, but it makes the cost visible, and a visible cost can be tested against. The aim of strategy validation is to meet that cost on paper, where it is cheap to learn from, rather than in a live account, where it is not.
A checklist before you trust a backtest
Before trusting a backtest, ask:
- Was slippage applied on both entry and exit?
- Does the slippage assumption change with the instrument's liquidity?
- Does it widen in fast markets?
- Does order size matter relative to the volume actually traded?
- Were brokerage, taxes, and exchange charges modelled separately from slippage?
- Does the strategy still work if slippage is doubled?
- Is the strategy frequent enough that small slippage compounds?
- Would a market order and a limit order produce different results?
An idea is not a strategy until it has survived the prices the market would actually have given, not the ones the rule hoped for. That is the work daZh by Zudora is built around: a no-code platform designed to make slippage and realistic-fill assumptions part of the validation process, so a strategy is measured against the execution it would plausibly have met rather than an idealised one, before any capital is committed. A test cannot promise the next fill. But pricing an edge against the execution cost the market would really have charged is what lets a trader trust a backtest instead of just admiring it.
Related concepts
- Strategy validation, where execution costs like slippage are met on tested ground.
- Out-of-sample testing, the check that an edge survives data it was not built on.
- How to Backtest an Options Strategy.
Disclaimer: daZh is a software platform for building, testing, and managing user-defined trading strategies. It does not provide investment advice, stock recommendations, guaranteed returns, or profit assurance. Backtests are based on historical data and assumptions; actual trading results may differ.
Sources
- André F. Perold, "The Implementation Shortfall: Paper versus Reality", The Journal of Portfolio Management, Vol. 14, No. 3, Spring 1988, pp. 4 to 9. https://jpm.pm-research.com/content/14/3/4
- CFA Institute, "Trade Strategy and Execution", CFA Program Level III refresher reading, 2026 curriculum. https://www.cfainstitute.org/insights/professional-learning/refresher-readings/2026/trade-strategy-execution
- B. Tóth, Z. Eisler, and J.-P. Bouchaud, "The square-root impact law also holds for option markets", arXiv, February 2016. https://arxiv.org/abs/1602.03043
- SEBI, "Analysis of Profits and Losses in the Equity Derivatives Segment (FY22-FY24)", study, September 23, 2024. https://www.sebi.gov.in/reports-and-statistics/research/sep-2024/study-analysis-of-profits-and-losses-in-the-equity-derivatives-segment-fy22-fy24-_86905.html
- "Slippage (finance)", orientation reference, accessed June 2026. https://en.wikipedia.org/wiki/Slippage_(finance)