Picture a Nifty contract a few days from expiry, hovering near 24,000, with a view that it will still be near 24,000 when the week ends. A long butterfly option strategy is built for precisely that view. Buy one call at 23,800, sell two at 24,000, and buy one at 24,200, all expiring the same day, and the shape of the trade follows the conviction: if the index pins the middle strike, the position pays the most it can; if it drifts far in either direction, the loss is capped at the small amount paid to open it.
That capped loss is the strategy's signature. A butterfly is a defined-risk, defined-reward position: the worst case is known the moment the trade is placed, unlike the open-ended exposure of a naked option sale. Defined risk is the whole appeal, and it is also the whole catch. The structure is simple to draw and the maximum loss is comfortably small, which can make it look safer than it trades. This guide walks the full path, build then backtest then validate, treating every strike, expiry, and rule as a hypothesis to test rather than advice to follow.
Defined risk is the whole appeal, and it is also the whole catch.What a long butterfly spread is
A long butterfly is four option legs at three equally spaced strikes, all sharing one expiry. The Options Industry Council describes the call version as "Long 1 XYZ 65 call," "Short 2 XYZ 60 calls," and "Long 1 XYZ 55 call": you buy one at the lower wing, sell two at the middle body, and buy one at the upper wing, the wings equidistant from the body. A put butterfly uses the same shape with puts and behaves the same way at expiry. Both are entered for a net debit, the cash paid up front to open all four legs.
The payoff is a tent. The maximum profit, the OIC notes, is the "High strike minus middle strike minus net premium paid", earned only if the underlying finishes exactly at the middle strike at expiry. The maximum loss is the net premium paid, and it is suffered whenever the underlying closes beyond either wing. There are two breakeven points, per the OIC: the lower one is the lowest strike plus the net debit, and the upper one is the highest strike minus that debit. Figure 1 shows the full shape, with the wings, the body, the two breakevens, and the capped loss marked.
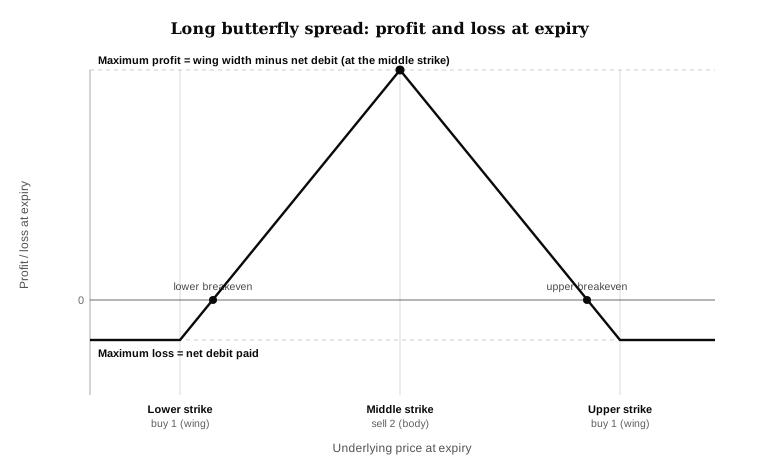
Figure 1: A long butterfly pays the most only at the middle strike and loses the full debit beyond either wing; the breakevens are the lower strike plus the debit and the upper strike minus it. Illustrative figures.
The market view behind it is neutral. The OIC frames the long butterfly as a strategy that wants the underlying to settle at a specific price, neither rising nor falling far. Two forces then drive it: positive theta, so time decay helps when the body sits at the money, and negative vega, so the OIC notes that "an increase in implied volatility will usually have a slightly negative impact". Implied volatility is the market's expectation of future movement priced into an option. In short, a long butterfly prefers a calm market that drifts toward the body and stays there.
How to build a butterfly option strategy as a no-code rule set
A trading rule is a fully specified instruction with no room left for judgement, and a butterfly converts into one cleanly. The structure is fixed by definition, so the decisions are the strikes, the spacing, the expiry, and the entry and exit conditions. Strikes can be placed a fixed distance from the current price, or by a target on the option's delta, the sensitivity of its price to a move in the underlying. The spacing between the wings sets both the cost and the maximum profit: wider wings cost more and can pay more, narrower wings pin a tighter zone for less.
The expiry is its own decision: a weekly butterfly placed close to expiry leans hardest on time decay and needs the underlying near the body already, while one with more days to run is cheaper to be wrong on but slower to mature. The entry condition is where a discretionary idea becomes testable, entering only when the underlying is within a defined band of the body strike, or when implied volatility is above a threshold, since a butterfly bought when option prices are richer is expected to gain as that volatility eases.
The structure is simple to draw and the maximum loss is comfortably small, which can make it look safer than it trades.The exit needs the same precision: hold to expiry, close at a fixed fraction of the maximum profit, or cut at a defined loss to avoid the pin risk of the short middle legs. Each is a separate hypothesis to search honestly and then validate, not a setting to trade on faith.
How to backtest it honestly
A backtest replays the rule against historical data and reports what it would have done. The CFA Institute frames the exercise as estimating "how would this strategy have performed if it were implemented in the past." For a butterfly that means reconstructing all four legs from historical option prices at each step, valuing the spread as a whole, applying the rules, and recording every trade. What comes out is gross until costs are charged against it, and with a butterfly those costs are unusually heavy relative to the edge.
Four legs mean four spreads to cross, and the butterfly's edge is thin enough that the spreads alone can erase it. Each leg pays brokerage, the securities transaction tax, exchange and regulatory charges, and GST, and each carries a bid-ask spread, the gap between the price a buyer pays and a seller receives, paid through slippage on every entry and exit. A backtest that fills at the mid-price flatters the strategy twice, on the way in and the way out, across four legs each time. Since the maximum profit is often a modest multiple of the debit, a few rupees of slippage per leg is not a rounding error; it is a real share of the reward.
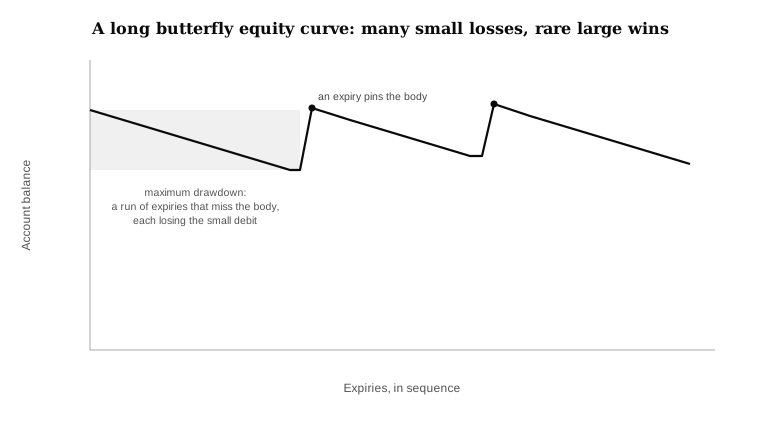
Figure 2: A long butterfly loses the small debit on the many expiries that miss the body and recovers it on the rare ones that pin it, so the clustering of misses, not the average expiry, defines the drawdown. Illustrative figures.
Liquidity is the next trap. The body at the money is usually deep and tight, but the wings sit further out where contracts can trade thinly, so a price found there may be stale or unreachable, and a backtest that places wings on illiquid strikes is trading prices that were never really available. Settlement matters too: index options on the National Stock Exchange are cash-settled, while single-stock options can involve physical settlement at expiry, so a model that ignores settlement mechanics can misstate the risk. The metrics then read in pairs of reward and pain. The win rate, the share of trades that make money, can mislead in either direction here, so expectancy, the average outcome per trade after costs, and the maximum drawdown, the largest peak-to-trough fall in the account shown in Figure 2, are the honest summary.
Four legs mean four spreads to cross, and the butterfly's edge is thin enough that the spreads alone can erase it.How to validate it
Validation is the step that separates a real edge from a curve fitted to one calm stretch of history, and a butterfly invites that fitting. The dials are few, the strikes, the wing width, the expiry, the entry band, so it is easy to sweep dozens of combinations and keep the one with the prettiest curve, which is usually the most overfit setting in the set rather than the most trustworthy. Marcos López de Prado, in Advances in Financial Machine Learning, shows that the more configurations you test on the same data, the more likely the best one is luck rather than skill, a trap called overfitting.
The defences are straightforward. The first is out-of-sample testing: hold back a slice of expiries the tuning never touches, fit the strikes and rules on the rest, then test once on the untouched slice. The stronger version is walk-forward analysis, which rolls that split forward through time, repeatedly tuning on one window and testing on the next unseen one, so the rule has to keep working as conditions change. For a butterfly that matters because the underlying's habit of sitting still in one period is no promise it will in the next.
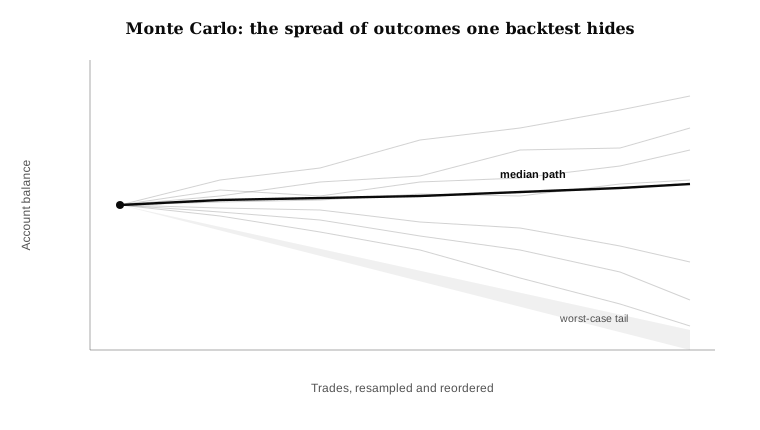
Figure 3: Monte Carlo resampling reorders the trades thousands of times to show the range of outcomes one backtest could have produced. For a butterfly the question is how long a run of missed bodies the account can absorb. Illustrative figures.
The test that earns its keep most here is the Monte Carlo simulation in Figure 3. A butterfly's risk is not a sudden blow-up; it is a long run of expiries that miss the body, each costing the debit, before a winner arrives, and Monte Carlo makes the length of that run visible before capital meets it. Its sensitivity to the implied volatility regime and the option greeks should be checked too, because a butterfly bought into high volatility behaves very differently from one bought into calm. Together these turn a backtest into honest strategy validation.
Limits and pitfalls
The deepest limit is the one the capped loss hides: the profit zone is narrow and the full reward is a single point. The maximum profit is paid only if the underlying settles exactly at the middle strike, which almost never happens. The realistic outcome is somewhere on the slope, a partial gain or the small loss of the debit, so the few wins have to be large and frequent enough to cover the steady drip of small losses, with four sets of costs raising that bar further.
The other pitfalls are specific. Pin risk near expiry leaves the two short legs in doubt about physical settlement on single-stock contracts, illiquid wings widen the spreads exactly where the strategy can least afford them, and a defined-risk label can encourage oversizing until a cluster of losing expiries adds up. For context, SEBI's study of the derivatives segment found that 93% of individual F&O traders incurred losses between FY22 and FY24, with aggregate losses exceeding ₹1.8 lakh crore. That is backdrop, not a verdict on any one rule. A long butterfly is a reasonable hypothesis with a known worst case, and honest testing is what tells a hypothesis from an edge.
The maximum profit is paid only if the underlying settles exactly at the middle strike, which almost never happens.A checklist before you trust a long butterfly spread strategy
Before you treat a clean payoff diagram as an edge, run the rule past a few honest questions.
| Checklist question | Why it matters |
|---|---|
| Did I define the strikes, expiry, entry, and exit before testing? | Prevents discretionary hindsight |
| Are brokerage, taxes, and slippage charged on all four legs? | Four legs make costs a real share of a thin reward |
| Is the maximum loss known and acceptable at my position size? | Defined risk can still compound across a run of losing expiries |
| Did the rule survive out-of-sample expiries? | Tests whether it generalises beyond the tuned window |
| Did walk-forward results stay stable? | Tests whether the strikes and rules hold as conditions change |
| Did Monte Carlo show a survivable run of missed bodies? | Tests how long a drawdown of small debit losses the account can absorb |
| Did I check liquidity at the wings and assignment on the short body? | Thin wings and physical settlement on single-stock legs can break the modelled payoff |
Frequently asked questions
What is a long butterfly option strategy?
It is a four-leg options position at three equally spaced strikes of the same expiry: buy one option at a lower strike, sell two at a middle strike, and buy one at a higher strike. It is entered for a net debit and profits when the underlying settles near the middle strike at expiry. It can be built with calls or puts, and both behave the same way.
Is a long butterfly defined-risk or undefined-risk?
It is defined-risk and defined-reward. The maximum loss is the net debit, suffered if the underlying closes beyond either wing strike. The maximum profit is the distance from a wing to the body minus the debit, paid only if the underlying finishes at the middle strike. Both are known when the trade is placed.
What are the breakeven points of a long butterfly?
There are two: the lowest strike plus the net debit, and the highest strike minus the net debit. Between them the position makes money, peaking at the middle strike; outside the wings it loses the full debit. When the debit is small the breakevens sit close to the wings, leaving a wider profitable band; a larger debit pulls them in toward the middle strike and narrows it.
When does a long butterfly make money?
When the underlying drifts toward the middle strike and settles near it at expiry, and ideally when implied volatility eases, since the position has negative vega and positive time decay at the money. It is a neutral, range-bound hypothesis, not a directional bet, and the maximum profit is reached only at the exact middle strike.
How do you backtest and validate a butterfly strategy?
Reconstruct all four legs from historical option prices, charge brokerage, taxes, and slippage on every leg, and fill at the bid and ask rather than the mid-price. Then test out-of-sample on expiries the tuning never touched, roll that split forward with walk-forward analysis, and use Monte Carlo resampling to see how long a run of missed bodies the account could survive.
Is a backtested butterfly result a prediction of future returns?
No. A backtest describes how a rule behaved on historical data under stated assumptions. Past performance does not guarantee future results, and live spreads, costs, liquidity at the wings, and volatility regimes can differ sharply from the test.
A butterfly is one of the most elegant payoff shapes in options, a defined-risk tent that profits from stillness, which is why a clean diagram deserves the hardest testing rather than a screenshot of one quiet expiry. The narrow profit zone, the four sets of costs, and the underlying's refusal to pin the body on demand are where the idea is won or lost. That is what daZh by Zudora is built to probe: a no-code platform where a multi-leg options rule like this can be specified with a visual leg configurator, backtested across history, then put through parameter optimisation, walk-forward analysis, overfitting detection, and Monte Carlo validation before any capital is committed.
Related guides
- Iron condor strategy: how to build, backtest, and validate it
- Iron fly strategy: how to build, backtest, and validate it
- Calendar spread strategy: how to build, backtest, and validate it
- Implied volatility and the option greeks
- Pillar: How to backtest an options strategy
Disclaimer: daZh is a software platform for building, testing, and managing user-defined trading strategies. It does not provide investment advice, stock recommendations, guaranteed returns, or profit assurance. Backtests are based on historical data and assumptions; actual trading results may differ.
Sources
- The Options Industry Council (OIC), "Long Call Butterfly", options strategy reference (leg structure, net debit, maximum profit, maximum loss, breakevens, neutral outlook). https://www.optionseducation.org/strategies/all-strategies/long-call-butterfly
- The Options Industry Council (OIC), "Long Put Butterfly", options strategy reference (put-version structure, neutral outlook, time decay, implied-volatility effect). https://www.optionseducation.org/strategies/all-strategies/long-put-butterfly
- CFA Institute, "Backtesting and Simulation", CFA Program refresher reading, 2026 curriculum. https://www.cfainstitute.org/insights/professional-learning/refresher-readings/2026/backtesting-and-simulation
- Marcos López de Prado, "Advances in Financial Machine Learning", Wiley, 2018 (backtest overfitting). https://www.wiley.com/en-us/Advances+in+Financial+Machine+Learning-p-9781119482086
- SEBI, "Updated study reveals 93% of individual traders incurred losses in equity F&O (FY22 to FY24); aggregate losses exceed ₹1.8 lakh crore", press release, September 23, 2024. https://www.sebi.gov.in/media-and-notifications/press-releases/sep-2024/updated-sebi-study-reveals-93-of-individual-traders-incurred-losses-in-equity-fando-between-fy22-and-fy24-aggregate-losses-exceed-1-8-lakh-crores-over-three-years_86906.html