
Picture a Nifty option chain a few days before a weekly expiry. Sell the at-the-money call expiring this week, buy the call at the same strike expiring next month, and pay the difference, the net debit. The near-term option loses value fast because it has almost no time left; the longer-dated one bleeds slowly. A calendar spread harvests that gap in the speed of time decay, and gains a little more if implied volatility, the market's expectation of future movement priced into an option, drifts up while you hold.
On a payoff diagram the result is a neat tent peaking right at the strike, and that neatness is seductive. A tidy tent on a payoff diagram is a hypothesis about volatility and time, not a promise about either. This guide walks the full path, build, backtest, then validate, treating every strike, expiry, volatility filter, and exit rule as a hypothesis to test, not advice to follow. Its defined risk makes a calendar gentler than a naked straddle, but its edge lives entirely in volatility and time.
A tidy tent on a payoff diagram is a hypothesis about volatility and time, not a promise about either.What a calendar spread is and how its legs are structured
A calendar spread is two options on the same underlying, same strike, different expiry. The Options Industry Council describes the long call version as selling "one near-term call option" and buying "one longer-term call option with the same strike price." Because the longer-dated leg always costs more, the spread is established for a net debit, and that debit is the most it can lose. It is also called a time or horizontal spread. John C. Hull, in Options, Futures, and Other Derivatives, defines the same structure, and it works with two calls or two puts.
Stating the risk precisely matters. The Options Industry Council puts the maximum loss at the net premium paid: it occurs if the two options reach parity, when the underlying moves far enough that both legs expire worthless or both trade at intrinsic value. The same page places the maximum gain, held as a spread, at the strike on the near-term expiry, where the short leg decays to nothing while the long leg keeps most of its time value. Held as a spread, the risk is defined and the reward is capped.
Held as a spread, the risk is defined and the reward is capped.One wrinkle deserves a clear statement. If a trader lets the near-term option expire and keeps the longer-dated leg, the position converts into a single long option whose profit is open-ended; the Options Industry Council lists that converted outcome as "unlimited." That is a different trade. As a calendar spread, the structure stays defined-risk. Because the two legs expire on different dates, there is no clean algebraic breakeven; the Council notes it depends on the underlying price, implied volatility, and time decay. A calendar has two breakevens that bracket the strike, as Figure 1 shows.
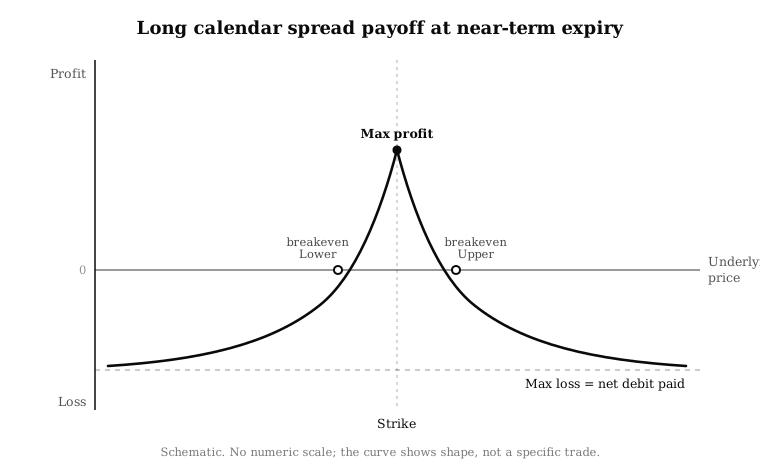
Figure 1: The calendar spread's payoff at the near-term expiry is a tent peaking at the strike. Outside the two breakevens the spread loses, with the loss capped at the net debit paid. Illustrative figures.
Building it as a no-code rule set
A trading rule is a fully specified instruction with no room for judgement, and a calendar spread converts cleanly into one. The skeleton is four decisions: the structure (two calls or two puts, same strike), the strike (usually at the money, where a calendar earns the most if the underlying stays put), the two expiries to sell and buy, and the net debit, which fixes the maximum loss before the first tick.
The variants are where the testing lives. A neutral calendar centres the strike at the money; a directional one shifts it above or below spot. The expiry gap and entry timing are dials too. The exits need the same rigour: a profit target on the debit, a stop past a breakeven, a time-based close before the near-term expiry to avoid pin risk, or a roll of the short leg. None is correct in the abstract; they are knobs to specify in advance and search honestly.
How to backtest it honestly
A backtest replays the rule against historical data and reports what it would have done. The CFA Institute frames the exercise as estimating "how would this strategy have performed if it were implemented in the past." For a calendar spread that means reconstructing both legs at every step, charging what it would cost to open and close two contracts, and recording the running balance.
Costs come first, and a calendar spread pays them twice. Every entry and exit is two legs, so each round trip carries brokerage on both, the securities transaction tax, exchange and regulatory charges, GST, and slippage, the gap between the price the rule wanted and the price it got. Liquidity makes this worse on the long leg: a further-dated strike can trade thinly, so its spread is wider and prices may be stale. Because the calendar's profit is a thin slice of extrinsic value, costs eat a larger share of it. A result that does not state whether it is net of costs is not a result you can act on.
A result that does not state whether it is net of costs is not a result you can act on.Settlement and assignment belong in the model, not the fine print. On the National Stock Exchange, index options on Nifty and Bank Nifty are European-style and cash-settled, so the short near leg cannot be exercised early. Single-stock options on NSE are European-style but physically settled, so there is no early assignment. However, an in-the-money short near-term leg held to expiry can create a delivery obligation. A backtest that ignores physical settlement and expiry obligations tests a position the trader could not have held. The honest summary metric is expectancy, read alongside the largest single loss and the maximum drawdown. Figure 2 shows why the average flatters this style.
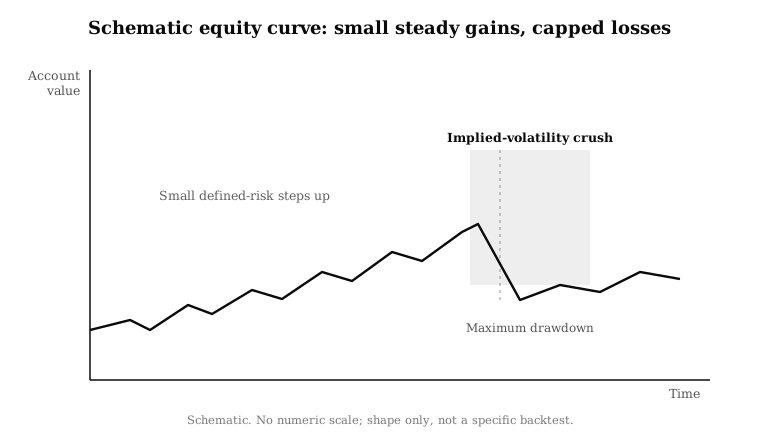
Figure 2: A calendar spread's equity curve climbs in small defined-risk steps, then gives a chunk back when the underlying jumps or implied volatility collapses on the leg you are long. The average trade flatters the rule; the worst stretch defines it. Illustrative figures.
How to validate it
This is the step that separates a real edge from a flattering stretch of history. A calendar spread has only a handful of dials, the strike offset, the two expiries, and the entry and exit thresholds, so it is easy to sweep dozens of combinations and keep the best curve. That is how a rule gets fitted to one period's noise, a trap called overfitting. Bailey, Borwein, López de Prado, and Zhu showed in a study of backtest overfitting that the more settings you try, the more likely the best one is luck rather than edge. The winner of a sweep is usually the most overfit setting, not the most trustworthy.
Validation is the set of tests built to catch that self-deception. Out-of-sample testing holds back a slice the tuning never touches, fits on the rest, then tests once on it. Walk-forward analysis, shown in Figure 3, rolls that split forward through time, tuning on a window and testing on the next unseen one. This matters more for a calendar than most strategies: the position is long implied volatility, and its profit depends on the volatility term structure between the two expiries holding up.
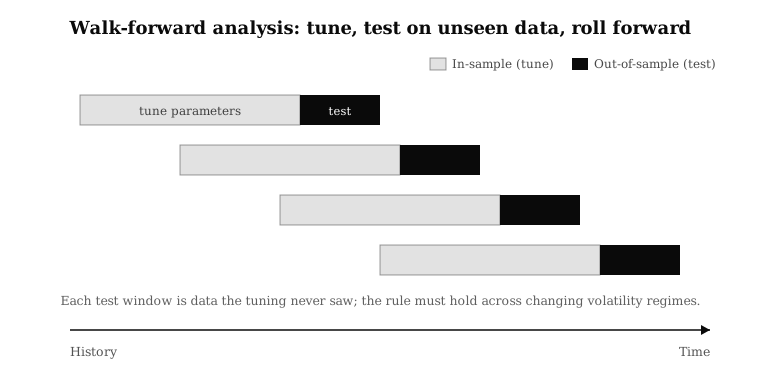
Figure 3: Walk-forward analysis tunes the calendar's parameters on an in-sample window, tests them once on the next unseen window, then rolls both forward. A rule that survives every test window across changing volatility regimes beats one fitted to a single stretch. Illustrative figures.
The test that earns its keep is the Monte Carlo simulation, which resamples or reorders the trade sequence thousands of times to reveal the range of outcomes the rule could have produced. A calendar's losses are capped at the debit, but a run of them in a row can still draw the account down hard, and Monte Carlo makes that sequence risk visible. With a look-ahead check that prices both legs only on data the rule could have seen, these turn a backtest into strategy validation. Most configurations that look excellent on one stretch do not survive it.
Limits and pitfalls
The deepest limit of a calendar spread is the same as its appeal: it is a bet on what does not happen. It wants the underlying to sit near the strike and volatility to hold or rise, and is hurt by the two things options markets do most often, move and reprice. A sharp directional move pushes the underlying past a breakeven and toward the maximum loss, capped at the debit but real. The danger that the equity curve hides is the day implied volatility collapses on the leg you are long. Because a calendar is long vega, a crush after an event can turn a position that looked safe at the strike into a loss.
The danger that the equity curve hides is the day implied volatility collapses on the leg you are long.The forces behind all of this are the option Greeks: a calendar spread is essentially a trade on theta and vega rather than direction, and its defined risk is a genuine advantage over selling options outright. But it sits inside a market where SEBI's study found that 93% of individual F&O traders incurred losses between FY22 and FY24, with aggregate losses exceeding ₹1.8 lakh crore. That is context, not a verdict on any one rule, and honest testing is what tells a hypothesis and an edge apart.
A checklist before you trust a calendar spread strategy
Before you treat a clean tent on a payoff diagram as an edge, run the rule past a few honest questions.
| Checklist question | Why it matters |
|---|---|
| Did I define the strike, both expiries, and the entry and exit rules before testing? | Prevents discretionary hindsight |
| Are brokerage, charges, and slippage included on both legs? | Prevents fantasy returns |
| Is the maximum loss, the net debit paid, known and acceptable on every trade? | Defines the risk before the trade is on |
| Did the rule survive out-of-sample data? | Tests whether it generalises |
| Did walk-forward results stay stable across volatility regimes? | Tests parameter robustness |
| Did Monte Carlo show survivable drawdowns? | Tests sequence risk |
| Did I test through an implied-volatility crush and a sharp directional move, not just calm periods? | A calendar is long vega, so falling volatility on the longer leg or a move past a breakeven is its specific failure mode |
Frequently asked questions
What is a calendar spread?
A calendar spread, also called a time or horizontal spread, sells a near-term option and buys a longer-dated one at the same strike for a net debit. It profits from the near leg decaying faster and is long volatility, so it gains if implied volatility rises.
What is the maximum loss and maximum profit on a calendar spread?
Held as a spread, the maximum loss is the net debit paid, realised if the two options reach parity. The maximum profit is limited and arrives when the underlying sits at the strike on the near-term expiry.
Is a calendar spread bullish, bearish, or neutral?
It can be any of the three. An at-the-money calendar is broadly neutral; shifting the strike above spot leans bullish, below leans bearish. Whatever the lean, it still depends on volatility holding up, because it is long vega.
Why does a calendar spread benefit from rising implied volatility?
The longer-dated leg you own is more sensitive to implied volatility than the near-dated leg you sold, so the net position is long vega. When volatility rises, the long leg gains more than the short leg loses; a crush on the longer leg does the reverse.
How do you validate a calendar spread strategy?
Test it net of all costs on out-of-sample history the tuning never touched, roll that split forward with walk-forward analysis to confirm it holds across volatility regimes, and use Monte Carlo resampling to see the range of outcomes and the worst drawdown.
Is a backtested calendar spread result a prediction of future returns?
No. A backtest describes how a rule behaved on historical data under stated assumptions. Past performance does not guarantee future results, and live conditions, costs, and volatility regimes can differ sharply from the test.
The tent-shaped payoff of a calendar spread is one of the more elegant ideas in options trading, which is why it deserves hard testing rather than a screenshot of one good month. A payoff that looks decisive on paper is a hypothesis until it survives unseen history, net of two-leg costs, with its sensitivity to a directional move and a volatility crush made visible. That survival is what daZh by Zudora is built to test: a no-code platform where a rule like this can be specified with a visual leg configurator, backtested across history, then put through parameter optimisation, walk-forward analysis, overfitting detection, and Monte Carlo validation. The goal is not a prettier backtest, but an honest answer to whether an idea has earned the right to be traded.
Related guides
- Butterfly option strategy: how to build, backtest, and validate it
- Iron condor strategy: how to build, backtest, and validate it
- Implied volatility and the option Greeks
- Walk-forward analysis, out-of-sample testing, and Monte Carlo simulation
- Pillar: How to backtest an options strategy
Disclaimer: daZh is a software platform for building, testing, and managing user-defined trading strategies. It does not provide investment advice, stock recommendations, guaranteed returns, or profit assurance. Backtests are based on historical data and assumptions; actual trading results may differ.
Sources
- The Options Industry Council (OCC), "Long Call Calendar Spread (Call Horizontal)", options strategy reference (leg structure, net debit, maximum loss as net premium paid, maximum gain at the strike on the near-term expiry, breakeven function, theta and vega effects). https://www.optionseducation.org/strategies/all-strategies/long-call-calendar-spread-call-horizontal
- John C. Hull, "Options, Futures, and Other Derivatives", Pearson (definition of the calendar spread: sell a short-maturity option, buy a longer-maturity option at the same strike). https://www.pearson.com/en-us/subject-catalog/p/options-futures-and-other-derivatives/P200000005938
- CFA Institute, "Backtesting and Simulation", CFA Program refresher reading, 2026 curriculum. https://www.cfainstitute.org/insights/professional-learning/refresher-readings/2026/backtesting-and-simulation
- NSE Clearing, "Settlement Mechanism, Equity Derivatives" (index options: cash-settled, European-style), https://www.nseclearing.in/clearing-settlement/equity-derivatives/settlement-mechanism ; SEBI, "Physical settlement of stock derivatives", circular dated December 31, 2018 (stock options physically settled), https://www.sebi.gov.in/legal/circulars/dec-2018/physical-settlement-of-stock-derivatives_41482.html
- SEBI, "Updated study reveals 93% of individual traders incurred losses in equity F&O (FY22 to FY24); aggregate losses exceed ₹1.8 lakh crore", press release, September 23, 2024. https://www.sebi.gov.in/media-and-notifications/press-releases/sep-2024/updated-sebi-study-reveals-93-of-individual-traders-incurred-losses-in-equity-fando-between-fy22-and-fy24-aggregate-losses-exceed-1-8-lakh-crores-over-three-years_86906.html
- David H. Bailey, Jonathan M. Borwein, Marcos López de Prado, Qiji Jim Zhu, "Pseudo-Mathematics and Financial Charlatanism: The Effects of Backtest Overfitting on Out-of-Sample Performance", Notices of the American Mathematical Society, 61(5), May 2014. https://papers.ssrn.com/sol3/papers.cfm?abstract_id=2308659