
A chart shows the price sliding toward the lowest of three curving lines, and the reflex is immediate: the market looks cheap, the band is right there, so buy. That single reflex is where most of the trouble with a Bollinger Bands strategy begins. John Bollinger, who built the tool in the early 1980s, is blunt about it in his published band rules. A tag of the lower band is not a buy signal, and a tag of the upper band is not a sell signal. The bands describe where price sits, high or low on a relative basis. They do not tell you what to do next.
The honest version of the work has three stages, and they run in order. Build the idea into rules a computer can follow. Backtest those rules against history with trading costs included. Then validate the result. One good backtest is the easiest thing in the world to produce and the least trustworthy. This guide walks that full path, and treats every rule below as a configuration to test, never as a recommendation to trade.
The governing idea is simple and uncomfortable. An indicator rule is a hypothesis, and most hypotheses do not survive honest testing. The job of a build-backtest-validate workflow is to find that out cheaply, on a screen, rather than expensively, with live capital.
A tag of the lower band is not a buy signal, and a tag of the upper band is not a sell signal.What Bollinger Bands measure
Bollinger Bands are three lines drawn in and around price. Bollinger defines them as curves "that answer the question as to whether prices are high or low on a relative basis", according to his own description of the tool. The middle line is a simple moving average, the running average of the last several closing prices. The outer two are placed a set distance above and below it, and that distance is the part that matters.
That distance is measured in standard deviations, a statistical gauge of how much price has been scattering around its average. When price gets choppy the bands widen; when it goes quiet they pull in. The default settings, Bollinger notes, are unchanged since he created them: a 20-period moving average with the bands set at plus and minus two standard deviations of the same data. Because the width tracks volatility, the bands adapt to conditions on their own rather than sitting at a fixed percentage from the average.
Two derived readings come up constantly. %b states where the last price sits relative to the bands, where 1 is the upper band and 0 is the lower; in his band rules, Bollinger notes that "Indicators can be normalized with %b, eliminating fixed thresholds in the process". BandWidth measures how far apart the bands are, calculated as the upper band minus the lower band, divided by the middle band, per StockCharts ChartSchool. Its best-known use is spotting "the Squeeze", a stretch of unusually low volatility where the bands contract. Figure 1 shows the picture a builder is actually working from.
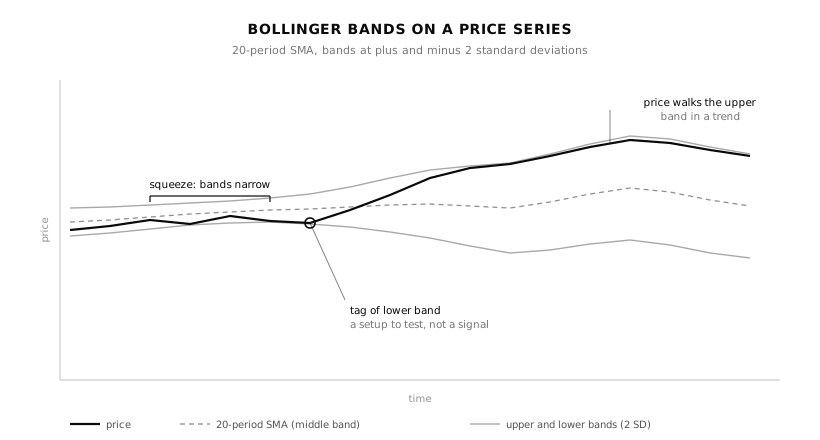
Figure 1: Bollinger Bands on a price series. The squeeze marks low volatility, a band tag is a setup rather than a signal, and in a trend price can walk along a band instead of reversing off it. Illustrative figures.
Building the Bollinger Bands strategy as a rule set
To test an idea, a no-code platform needs it written as rules with no ambiguity left in them. Bollinger Bands support two well-known and opposing rule families, and the first decision is which hypothesis you are testing.
The first is mean reversion, the idea that price stretched far from its average tends to snap back. Mean reversion treats the bands as elastic edges. A plain version to test reads like this: enter long when the close crosses back above the lower band after tagging it, exit when price reaches the middle band or the upper band, and cap the loss with a stop below the recent low. The mirror rule shorts the upper band. The bands set the levels; %b can express the same logic as a number, for instance entering when %b rises back above 0.
The second is the squeeze breakout, which tests the opposite belief: that a quiet market is coiling for a move. Here BandWidth falling to a multi-month low flags the squeeze, and the rule waits for price to close outside a band before entering in that direction, on the theory that low volatility precedes high volatility. The squeeze names the timing, not the direction, which the breakout itself has to confirm.
A handful of parameters define either version, and each is a dial to test, not a setting to assume.
| Parameter | Standard | Common variants to test |
|---|---|---|
| Moving average length | 20 | 10 to 50 |
| Standard deviations | 2 | 1.5 to 2.5 |
| Average type | Simple | Exponential |
| Exit target | Middle band | Opposite band |
| Stop placement | Recent swing | ATR multiple |
Illustrative configuration ranges, not recommendations.
Two cautions belong here, both from Bollinger's own rules. He pairs the bands with a second, unrelated indicator "derived from momentum, volume, sentiment" so that two independent readings have to agree before a trade. And he warns that in trending markets "price can, and does, walk up the upper Bollinger Band and down the lower Bollinger Band", which is exactly when a naive mean-reversion rule sells every step of a rally. A rule set is a hypothesis stated precisely enough to be proven wrong.
An indicator rule is a hypothesis, and most hypotheses do not survive honest testing.Backtesting the rules
A backtest replays the rules over historical data and reports what they would have done. The number it produces is only as honest as the assumptions behind it, and the first assumption to get right is cost. Every real trade on the NSE pays brokerage, statutory charges, and slippage, the gap between the price a rule asks for and the price it actually fills at. A Bollinger Bands strategy can trade often, especially when band tags or short squeeze windows are treated too loosely, and can hand its entire paper profit to costs without the gross curve ever hinting at trouble. A backtest that excludes costs measures an edge no account could capture.
The metrics worth reading go well beyond total return. Maximum drawdown, the largest peak-to-trough fall in the account, tells you whether the rule is survivable. The Sharpe ratio measures return earned per unit of volatility, a way to compare a smooth edge against a wild one. CAGR, the compound annual growth rate, states the smoothed yearly pace. Expectancy, the average outcome per trade after wins and losses are netted, decides whether the rule has any edge at all. Win rate alone is close to meaningless: a rule that wins often but loses big on the misses can still bleed.
A backtest that excludes costs measures an edge no account could capture.Figure 2 shows why one curve is never enough. The same rules, scored before costs on the data they were tuned on, look far better than the same rules scored after costs on data they have not seen.
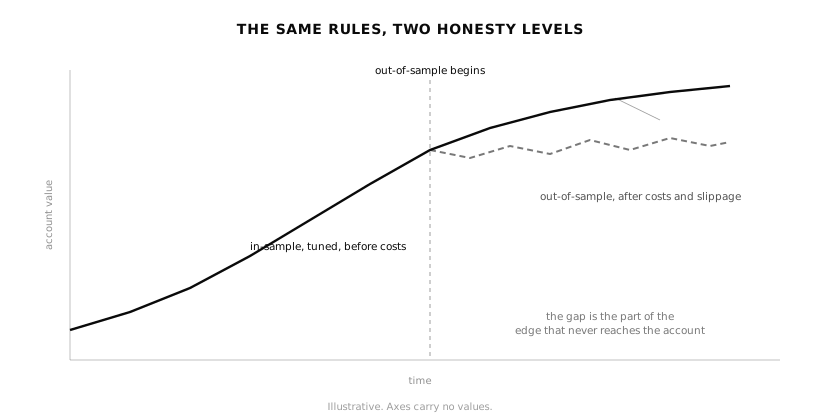
Figure 2: The same rules, two honesty levels. The gap between a tuned, pre-cost curve and an after-cost, out-of-sample one is the part of the apparent edge that never reaches the account. Illustrative figures, axes carry no values.
Validating it: the step most traders skip
This is where a Bollinger Bands strategy earns trust or fails to, and it is the step most traders skip. A single backtest, however clean, is not proof. Tune the length, the band width, the exit, and the stop against one stretch of history, and a rule will eventually fit that stretch's noise rather than any real pattern. That trap is overfitting, and the more configurations you try, the likelier the winner is luck. Bailey, Borwein, Lopez de Prado, and Zhu show in "Pseudo-Mathematics and Financial Charlatanism" that with enough trials, an impressive in-sample backtest can be produced from data with no edge in it at all.
Three checks push back. The first is out-of-sample testing: hold back a slice of history the tuning never touches, then test there. An edge that evaporates on unseen data was never an edge. The second is walk-forward analysis, which automates that discipline by repeatedly optimising on one window and validating on the next, rolling forward through time, so the rule has to keep working as conditions change rather than in one lucky era. Figure 3 shows the shape of it. The CFA Institute treats this kind of rolling, out-of-sample procedure as standard practice in its reading on backtesting and simulation.
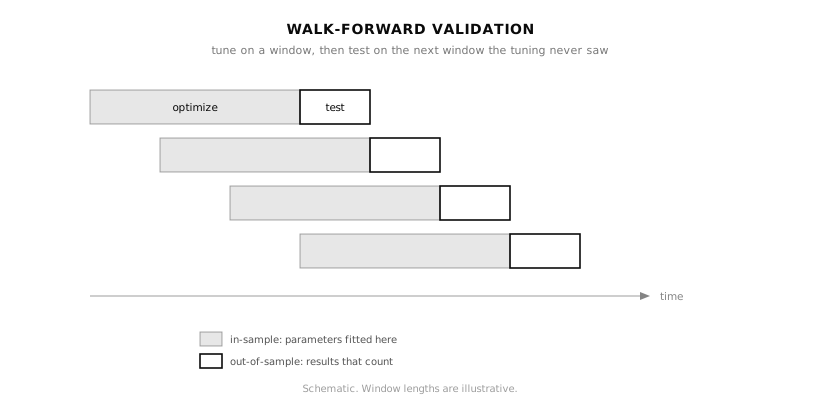
Figure 3: Walk-forward validation. The strategy is tuned on each in-sample window, then judged only on the next window it has never seen, repeated as the test rolls forward. Schematic, window lengths are illustrative.
The third is Monte Carlo simulation, which reshuffles the order of trades or resamples them thousands of times to map the range of outcomes the rule could have produced. It answers a question a single equity curve hides: how much of the result was the rule, and how much was the order in which luck arrived. Together these turn a backtest into strategy validation. One in-sample run tells you a rule once fit the past; validation tells you whether it has any claim on the future.
One good backtest is the easiest thing in the world to produce and the least trustworthy.Limits and pitfalls
Bollinger Bands have known weaknesses, and a tested strategy has to account for them rather than wish them away. The sharpest is regime dependence. A mean-reversion rule that fades the bands works in a ranging market and is punished in a trending one, the case Bollinger flags when he notes that price can walk a band for a long time. The same rule set can look brilliant across two calm years and ruinous across one trending quarter, which is the entire argument for testing across regimes rather than a single favourable window.
The second pitfall is parameter overfitting dressed up as optimisation. It is tempting to search across moving-average lengths and band widths until one combination shows a spotless backtest. That combination is usually the one best fitted to the past's noise, and it tends to be the most fragile out of sample. The defence is to prefer rules that hold up across a range of nearby settings, not the single peak.
Costs are the third. Squeeze and reversion rules trade frequently, and Bollinger himself stresses that the bands "do not provide continuous advice; rather they help identify setups where the odds may be in your favor". Treating every band tag as an instruction generates churn, and churn is where costs quietly consume an edge. A rule that ignores realistic brokerage, statutory charges, and slippage is testing a market that does not exist.
A checklist before you trust a Bollinger Bands strategy
Before a band rule earns live capital, run it past the same short list of questions that separates a tested edge from a good-looking curve.
| Checklist question | Why it matters |
|---|---|
| Did I define entry and exit rules before testing? | Prevents discretionary hindsight |
| Are brokerage, charges, and slippage included? | Prevents fantasy returns |
| Were the indicator's settings and thresholds chosen before testing? | Reduces curve-fitting |
| Did the rule survive out-of-sample data? | Tests whether it generalises |
| Did walk-forward results stay stable? | Tests parameter robustness |
| Did Monte Carlo show survivable drawdowns? | Tests sequence risk |
| Did I confirm the rule does not just fade a trending band, given that price can walk the band without reversing? | Catches the regime where a band tag is a setup, not a reversal |
Frequently asked questions
What is the best Bollinger Bands strategy?
There is no single best one, and any source promising one is overstating the case. The two common families are mean reversion, which fades the bands, and squeeze breakouts, which trade the expansion after low volatility. Which holds up depends on the instrument and market regime, and the only way to know is to backtest and validate each as a hypothesis.
What are the standard Bollinger Bands settings?
A 20-period simple moving average with the bands set at plus and minus two standard deviations. John Bollinger notes these defaults are unchanged since he created the tool, though the length and width are parameters worth testing rather than treating as fixed.
Is a tag of the band a buy or sell signal?
No. Bollinger states plainly that a tag of the upper band is not a sell signal and a tag of the lower band is not a buy signal. The bands define where price is high or low on a relative basis; a tag is a setup to investigate, not an instruction.
What is the Bollinger Band squeeze?
A squeeze is a period of unusually low volatility, seen when the bands contract and BandWidth falls to a multi-month low. The theory is that low volatility precedes high volatility, so a squeeze suggests a larger move may be coming, but it does not say in which direction.
Do Bollinger Bands work for intraday trading?
Bollinger says the bands can be used on bars of any length, from five minutes to weekly. Whether a specific intraday rule has an edge is a separate question that only out-of-sample and walk-forward testing, with realistic costs, can answer.
Why does a profitable backtest still fail live?
Usually because it was overfit to one stretch of history, ignored trading costs and slippage, or was never tested out of sample. A rule tuned to fit past noise can show an excellent in-sample backtest and have no real edge, which is what validation is designed to expose.
A Bollinger Bands strategy is worth exactly as much as the evidence behind it, and that evidence is built in stages: a rule precise enough to test, a backtest honest enough to include costs, and validation strict enough to try breaking the rule before the market does. That validation layer, between a trading idea and live capital, is what daZh by Zudora is built around, with no-code rule building, walk-forward and Monte Carlo testing, parameter optimisation, and analytics that lead with drawdown and risk rather than a headline return. The bands answer whether price is high or low. Whether a rule built on them deserves your capital is a question only testing can answer.
Related guides
- RSI trading strategy
- Moving average crossover strategy
- Supertrend strategy
- Walk-forward analysis
- Out-of-sample testing
- Overfitting
- Backtesting software: how to choose one that tests honestly
Disclaimer: daZh is a software platform for building, testing, and managing user-defined trading strategies. It does not provide investment advice, stock recommendations, guaranteed returns, or profit assurance. Backtests are based on historical data and assumptions; actual trading results may differ.
Sources
- John Bollinger, "Bollinger Bands" (definition, creation, default settings of a 20-period moving average and plus and minus two standard deviations), bollingerbands.com. https://www.bollingerbands.com/bollinger-bands
- John Bollinger, "Bollinger Band Rules" (a tag is not a signal; price walks the band in trends; %b and BandWidth; the bands do not give continuous advice), bollingerbands.com. https://www.bollingerbands.com/bollinger-band-rules
- StockCharts ChartSchool, "Bollinger BandWidth" (BandWidth formula and the Squeeze; low volatility precedes high volatility). https://chartschool.stockcharts.com/table-of-contents/technical-indicators-and-overlays/technical-indicators/bollinger-bandwidth
- David H. Bailey, Jonathan M. Borwein, Marcos Lopez de Prado, Qiji Jim Zhu, "Pseudo-Mathematics and Financial Charlatanism: The Effects of Backtest Overfitting on Out-of-Sample Performance", Notices of the American Mathematical Society, 61(5), May 2014. https://papers.ssrn.com/sol3/papers.cfm?abstract_id=2308659
- CFA Institute, "Backtesting and Simulation", CFA Program refresher reading, 2026 curriculum. https://www.cfainstitute.org/insights/professional-learning/refresher-readings/2026/backtesting-and-simulation