
A backtest reports that a simple rule, hold the thirty largest listed companies and rebalance once a year, would have compounded capital handsomely over two decades. The logic looks sound and the equity curve is smooth. What the test never shows is the list it was built from: the thirty largest companies as they stand today. Every firm that was large twenty years ago and has since been delisted, merged away, or gone bankrupt is missing from the universe entirely, and with them go most of the losses. The strategy was tested on a roster of survivors. That distortion has a name, and it is survivorship bias.
Definition
"Survivorship bias is the distortion that arises when a sample contains only the subjects that survived a selection process, so the failures that dropped out are missing and the survivors make the whole look better than it ever was."
In plain terms, survivorship bias is the error of drawing conclusions from a group that has already had its failures removed. You measure the things still standing and forget the things that fell, because the fallen ones are no longer in front of you. In a trading context, the survivors are the stocks still listed, the funds still open, and the strategies still running, and the missing ones are exactly the cases a careful test most needed to see.
The strategy was tested on a roster of survivors.What survivorship bias is
The cleanest illustration of the idea comes from outside finance. During the Second World War, a research group studied bombers returning from missions to decide where to add armour. The damage on the returning planes clustered on the wings and the fuselage, so the instinct was to reinforce those areas. The statistician Abraham Wald argued the opposite. The planes in front of the analysts were the ones that had made it home; the planes hit in the engines and the cockpit were not in the sample, because they had been shot down. Armour belonged where the survivors showed no damage, because the planes hit there were the ones that never came back. The returning aircraft were a biased sample of all aircraft, and reading them at face value pointed exactly the wrong way. The American Mathematical Society recounts this episode as the textbook case of reasoning from a sample that has already been filtered by survival.
A backtest can make the same mistake without anyone noticing. The market is constantly retiring its losers. Companies are delisted when they fail to meet exchange requirements, absorbed in mergers, or wound up in insolvency. Funds that perform badly are quietly closed or merged into a sibling fund in the same family. An index drops its weakest constituents at each review and adds stronger ones, a process called reconstitution. By the time a trader downloads "the current members of the index" or "the funds available today", the data has already been cleaned of its failures. Testing a rule on that cleaned list is the trading equivalent of armouring the wings.
How survivorship bias creeps into a backtest
The mechanism is almost always the same: a strategy is tested against the universe as it looks now, rather than the universe as it looked at each point in the past. The first is a survivors-only universe. The second is a point-in-time universe, one that holds, for every date in history, exactly the securities that were actually investable on that date, including the ones that later disappeared. The gap between the two is where the bias lives.
Consider what a survivors-only test silently assumes. It assumes you could have known, twenty years ago, which companies would still be standing today, and held only those. No real portfolio had that foresight. A trader in the past held some names that went on to fail, took the losses, and only in hindsight does the list of survivors look like a sensible starting roster. The dropouts do not leave at random; they leave because they failed. Removing them does not remove noise, it removes the worst outcomes, and what is left tilts upward.
The dropouts do not leave at random; they leave because they failed.This is why the error is so common in systematic trading. Marcos Lopez de Prado, in his 2018 book on financial machine learning, lists survivorship bias first among the recurring flaws of backtesting, describing it as building a test on the current set of securities while ignoring those that were delisted or went bankrupt along the way. The CFA Institute groups it with the related traps in its treatment of backtesting, noting that analysts need to watch for survivorship bias and look-ahead bias when judging a simulated result. Look-ahead bias lets information leak backward in time; survivorship bias lets failure leak out of the sample. Both make the past look more tradeable than it was.
Figure 1 shows the shape of the distortion. Plot the returns of every name that existed at the start of a period, then strike out the ones that did not survive. The average of what remains sits to the right of the average of the whole, and the distance between them is the bias, an upward shift no investor could have captured in advance.
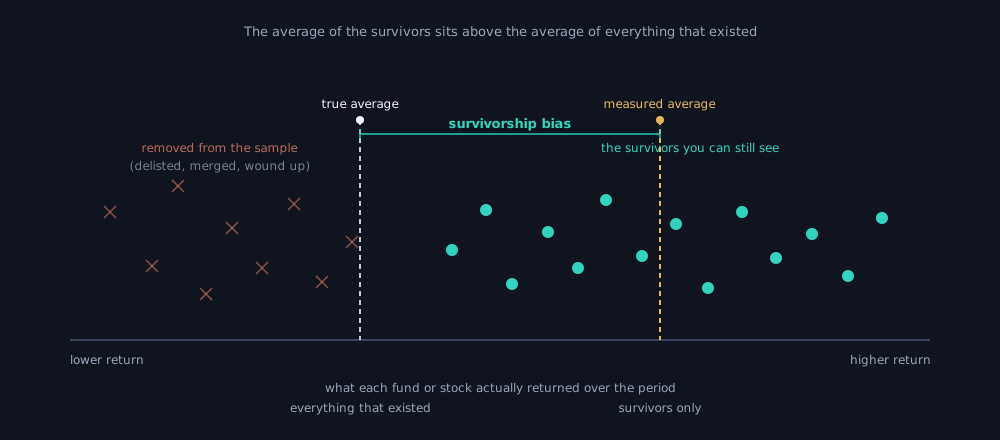
Figure 1: The failures drop out of view, and the average of the survivors sits above the average of everything that once existed. The gap is survivorship bias. Illustrative schematic.
How big the distortion can be
The size of the effect is not a matter of opinion; it has been measured. The landmark study is by Edwin Elton, Martin Gruber and Christopher Blake, published in the Review of Financial Studies in 1996. They tracked every mutual fund that existed at the end of 1976 and followed each one forward, calculating returns even for the funds that later merged away, by accounting for the terms of the merger. That let them compare what a survivors-only sample would have reported against the truth that included the disappeared funds.
Their framing of why the bias exists is worth quoting. "Mutual fund attrition can create problems for a researcher because the funds that disappear tend to do so either because their performance is very poor over a period of time or because their total market value is sufficiently small that management judges that it no longer pays to maintain the fund," they wrote, and so samples that do not correct for attrition will overstate the return that mutual funds earn for their investors. Attrition simply means funds dropping out of the data over time. Of the funds they tracked, roughly a third merged or disappeared and only about two-thirds survived the full period, so the survivors were far from the whole story.
How much did survival flatter the numbers? It depended on how returns were measured, as Figure 2 lays out.
| Basis of the estimate | Overstatement per year |
|---|---|
| Three-index risk-adjusted model, full sample | 0.91% |
| Reinvestment assumption, three-index model | 0.77% |
| Raw returns measured against the S&P 500 | 1.88% |
Source: Elton, Gruber and Blake (1996), Review of Financial Studies, Table 2.
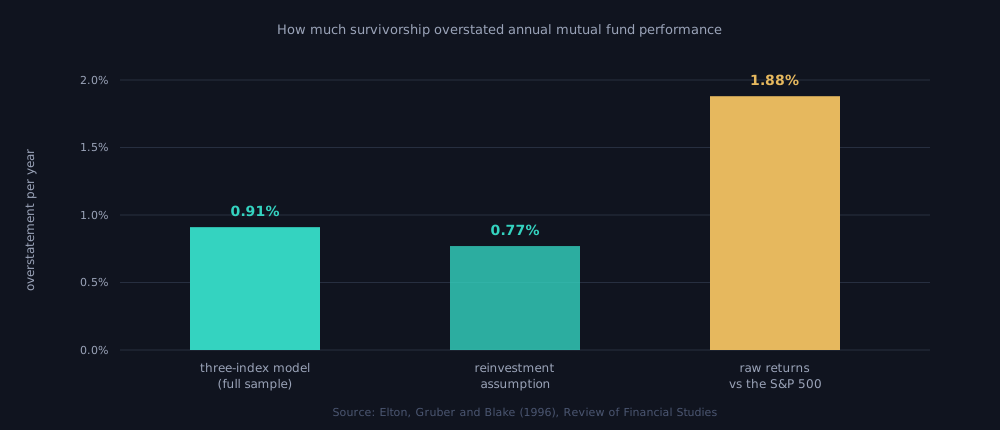
Figure 2: The annual overstatement Elton, Gruber and Blake attributed to survivorship, from roughly 0.9% on a risk-adjusted basis to about 1.9% measured on raw returns. Real figures, sourced from the 1996 study.
Just under one percentage point a year on a risk-adjusted basis sounds modest until it is compounded. A 0.91% annual edge that exists only in the data and not in any holdable portfolio, run over twenty years, quietly lifts a backtest's ending value by almost a fifth. The whole of that lift is fictional, an artefact of the names that were swept out before the test began. A universe of survivors carries an upward tilt no real portfolio could have captured in advance.
A universe of survivors carries an upward tilt no real portfolio could have captured in advance.How to read a backtest for it
The same logic that distorts fund data distorts a stock-screening backtest, and there it can be larger. Imagine a momentum rule that each year buys the strongest performers from a broad list of names. Run it on today's surviving companies and the worst-case constituents, the ones that collapsed and were delisted, are absent from every past year. The rule never has to live through holding a name that went to zero, because that name is not in the data. The reported track record improves for a reason that has nothing to do with the rule.
A small illustrative comparison shows the pattern. Take the same rule tested two ways over the same decade, once on the survivors-only list and once on the full point-in-time universe.
| Backtest setup | Reported CAGR | What it leaves out |
|---|---|---|
| Survivors-only universe (today's names) | 18% | every name that delisted, merged, or failed |
| Full point-in-time universe | 12% | nothing investable at the time |
Illustrative figures, not a real strategy or a recommendation.
The survivors-only test reports a compound annual growth rate, or CAGR, six percentage points higher, and none of that gap is a real edge. On a ₹10 lakh starting stake over ten years, the difference between an 18% and a 12% compounding rate is more than ₹20 lakh of phantom gain, a number that exists only because the losers were never in the room. Figure 3 traces the two equity curves diverging from the same start.
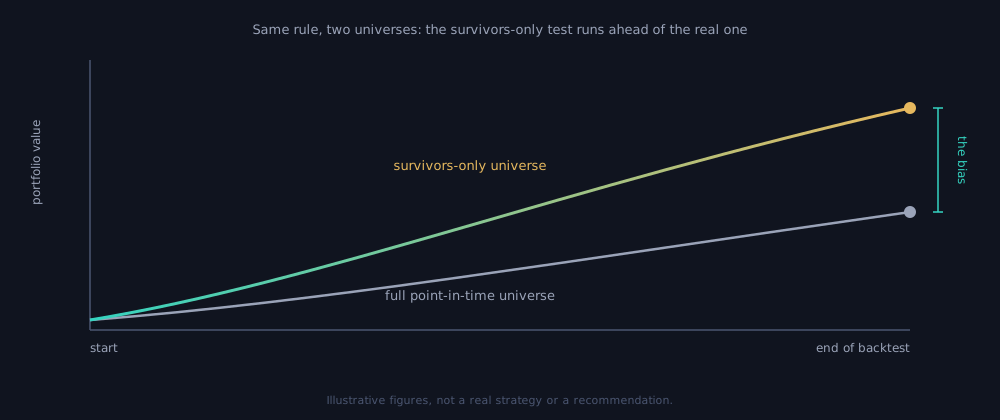
Figure 3: The same rule on two universes. The survivors-only curve runs ahead because the names that failed were removed before the test began. Illustrative figures.
The defence is straightforward to state and harder to source: test on a point-in-time universe that carries the dead names along with the live ones. Data providers that preserve delisted securities, with their delisting prices and the reason they left, make this possible; a list of "current constituents" does not. The honest test holds, for each past date, what was actually tradeable then, lets the strategy take the losses it would really have taken, and only then reports a return.
Limits and where it still hides
Even a careful tester can leave a door open. Survivorship bias overlaps with look-ahead bias, the related error of using information that was not yet available at the moment of a decision, and the two often travel together: a backtest that quietly knows which names survived is also, in effect, peeking at the future. Self-reported performance databases carry a cousin of the problem, because struggling funds and managers stop reporting before they close, so the index of "all managers" is really an index of those still willing to be counted.
Armour belonged where the survivors showed no damage, because the planes hit there were the ones that never came back.The bias also hides in places that do not look like a universe at all. A screen that starts from "stocks with at least ten years of history" silently excludes every company that did not last ten years. A study of "the best-performing strategies of the last decade" is survivorship bias in its purest form, since it begins by selecting on survival. The common thread is selecting a sample using an outcome that would not have been knowable in advance. Wherever a list has been filtered by who lasted, the average of that list is tilted, and the tilt is invisible unless you go looking for the names that are no longer there.
Common places survivorship bias hides
The same blind spot recurs in a handful of familiar places, each one a list that has quietly been cleared of its failures.
| Place it hides | The mistake |
|---|---|
| Current index constituents | Testing history using today's members |
| Delisted stocks | Removing names that failed or went bankrupt |
| Mutual fund databases | Counting only funds still open today |
| Minimum history filters | Excluding names that did not survive long enough |
| Strategy leaderboards | Studying only strategies that are still running |
| Merged companies | Treating disappeared firms as if they never existed |
A checklist before you trust a backtest's universe
Before trusting a backtest's track record, ask:
- Was the strategy tested on the universe as it looked at each past date, or as it looks today?
- Does the data include delisted, merged, and bankrupt names, with their delisting prices?
- Could you actually have known, in advance, which names to hold, or only in hindsight?
- For a fund or manager study, are the closed and merged funds counted, not just the survivors?
- Does any filter, such as a minimum history length, quietly select on survival?
- Did the strategy ever have to sit through holding a name that went to zero?
- If the dead names were added back, how much of the edge would remain?
Most of these questions have the same root: the difference between the world as it was and the world as it is now, after the failures have been cleared away. A backtest that cannot answer them is describing a market that was easier to trade than the real one, because every hard case has already been removed. Validating an idea means insisting on the full picture, the survivors and the casualties together, before any conclusion is drawn. That insistence is the heart of honest strategy validation: a result is only as trustworthy as the universe it was tested on, and a universe of survivors is no universe at all. The layer daZh by Zudora is built to be sits exactly here, between a trading idea and live capital, testing a rule against the market as it actually was rather than the flattering version history leaves behind. A backtest can only describe the data it is given, so the data has to include the names that did not make it.
Frequently asked questions
What is survivorship bias in backtesting?
Survivorship bias is testing a strategy only on the names that survived a period, while the stocks, funds, or strategies that delisted, merged, or were wound up have dropped out of the data. The survivors make the result look better than the full market ever was.
What is an example of survivorship bias?
Backtesting a rule on the thirty largest companies as they stand today. Every firm that was large twenty years ago and has since failed or been delisted is missing, so the test never has to hold the losers.
How does survivorship bias affect a backtest?
It tilts the result upward, because the dropouts usually left for poor performance. Elton, Gruber and Blake measured the overstatement in mutual fund data at roughly 0.9% a year on a risk-adjusted basis, which compounds into a large phantom gain over time.
How do you avoid survivorship bias?
Test on a point-in-time universe that includes the delisted, merged, and bankrupt names with their delisting prices, rather than a list of today's survivors, so the strategy has to take the losses it would really have taken.
What is a point-in-time universe?
A dataset that holds, for every past date, exactly the securities that were actually investable on that date, including the ones that later disappeared. It is the shared fix for both survivorship and look-ahead bias.
How is survivorship bias different from look-ahead bias?
Survivorship bias lets failures leak out of the sample; look-ahead bias lets future information leak backward into a past decision. Both flatter a backtest, and a survivors-only test often quietly does both at once.
Related concepts
- Look-ahead bias, the sibling error of using information that was not yet available at the time of a decision.
- Overfitting, fitting a strategy to the quirks of one history sample rather than a durable signal.
- Strategy validation, the full sequence that survivorship bias quietly undermines.
- How to Backtest an Options Strategy.
Disclaimer: daZh is a software platform for building, testing, and managing user-defined trading strategies. It does not provide investment advice, stock recommendations, guaranteed returns, or profit assurance. Backtests are based on historical data and assumptions; actual trading results may differ.
Sources
- Edwin J. Elton, Martin J. Gruber, Christopher R. Blake, "Survivorship Bias and Mutual Fund Performance", The Review of Financial Studies, Winter 1996, 9(4): 1097 to 1120. https://academic.oup.com/rfs/article-abstract/9/4/1097/1580100
- CFA Institute, "Backtesting and Simulation", CFA Program refresher reading, 2026 curriculum. https://www.cfainstitute.org/insights/professional-learning/refresher-readings/2026/backtesting-and-simulation
- American Mathematical Society, "The Legend of Abraham Wald", AMS Feature Column, June 2016. https://www.ams.org/publicoutreach/feature-column/fc-2016-06
- Marcos Lopez de Prado, "Advances in Financial Machine Learning", John Wiley & Sons, 2018, Chapter 11, "The Dangers of Backtesting". https://www.oreilly.com/library/view/advances-in-financial/9781119482086/c11.xhtml