
A backtest closes the year up 30 percent. The same rules, run live on the same instruments, finish up 11 percent. Nothing in the logic changed. What changed is everything that happens between the moment a rule says to trade and the moment money actually changes hands: a short delay before the order reaches the exchange, the order pushing the price as it fills, a slice of the position that never got bought, and the brokerage and taxes on top. Implementation shortfall is the single number that captures that whole gap, the difference between the return a strategy earns on paper, where every trade fills instantly at the price that triggered it, and the return it earns in reality.
Definition
"Implementation shortfall is the difference between the return of a paper portfolio that transacts instantly at the decision price and the return of the real portfolio that actually traded."
The framing comes from André Perold, who introduced it in a 1988 paper in The Journal of Portfolio Management. Perold separated the paper portfolio, which transacts at the price prevailing when the decision is made, from the real portfolio, which does not. The paper portfolio is a fiction: it buys the entire intended position at one clean price, the moment the idea is born, and pays nothing to do it. The real portfolio is what a trader is left with after the market has had its say. The distance between the two is the shortfall, and it is almost always a cost.
What implementation shortfall is
Most cost measures look at one thing at a time: the spread paid, the commission charged, the price moved. Implementation shortfall does the opposite. It is deliberately total. It starts from the decision price, the price on the screen at the instant a strategy commits to a trade, and it counts every rupee of return that the real position fails to capture against the imaginary one that traded perfectly. Nothing is left out, because the measure is defined as a subtraction, not a sum of named fees.
That makes it the broadest honest answer to a simple question: how much did it actually cost to turn this idea into a position? The CFA Institute curriculum treats it as exactly that, describing the implementation shortfall as the standard for measuring the total cost of a trade, comparing a portfolio's actual return with its paper return based on the decision price. A spread or a commission is a line item. Implementation shortfall is the bill.
This is also where it differs from slippage, the more familiar term. Slippage is one slice of implementation shortfall, not the whole of it. Slippage describes the gap between an expected fill price and the realized one, which lands inside the trading and delay pieces of the shortfall. But slippage says nothing about the shares that never filled, and it ignores fixed fees entirely. Implementation shortfall is built to catch both, which is why it is the measure that survives contact with a real broker statement.
Slippage is one slice of implementation shortfall, not the whole of it.How implementation shortfall is calculated
The calculation follows straight from the definition: value the paper portfolio, value the real portfolio, and take the difference. The paper portfolio buys the full intended order at the decision price and marks it to a later reference price, often the closing price on the day. The real portfolio buys only the shares it managed to fill, at the prices it actually paid, marks those to the same reference, and subtracts the fees. To put the number in context, the gap is usually divided by the size of the paper position and quoted in basis points, where one basis point is one hundredth of one percent.
Implementation Shortfall = Paper Return − Real Return

Paper Return = Order Shares × (End Price − Decision Price)
Real Return  = Shares Filled × (End Price − Avg Fill Price) − Fees

Order Shares   = the full intended order at the decision
Shares Filled  = the part of the order that actually traded
Decision Price = the price on the screen when the strategy committed
End Price      = a later reference price, often the day's close
Avg Fill Price = the average price actually paid on the filled shares
Fees           = brokerage, taxes, and exchange charges

As a cost:  IS = Delay + Trading + Opportunity + Fixed Fees
Quoted in basis points of (Order Shares × Decision Price)
This simple form is shown for a buy order. For sell orders, the price differences are sign-adjusted so that worse execution still increases the shortfall.
Figure 1 follows a single buy order through that arithmetic. A strategy decides to buy at a decision price of ₹500. By the time the order reaches the market the price has drifted to ₹502, and as the order fills it pushes the average cost to ₹503. Part of the order never fills, and the stock closes the day at ₹506, so the missed shares represent a profit the strategy planned for but never collected. The paper portfolio, which bought everything at ₹500 and held to ₹506, looks far better than the real one. What looked like a clean entry on paper was always going to be smaller once the market had its say.
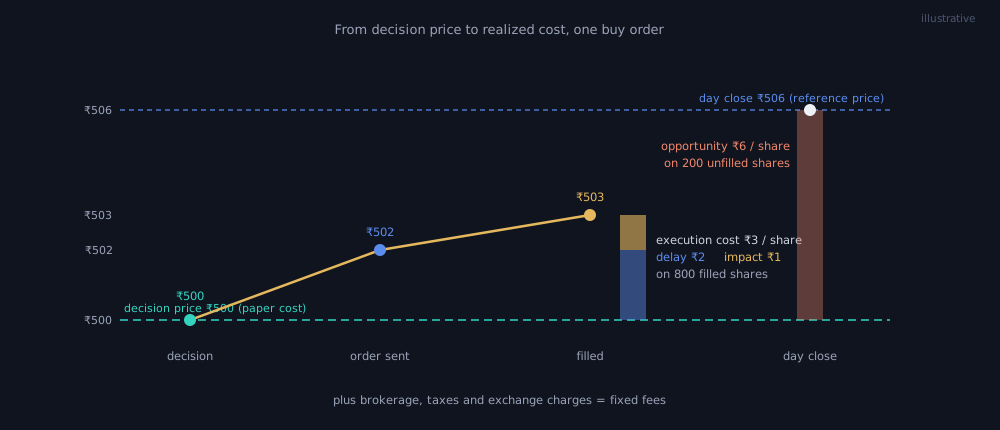
Figure 1: One buy order, from decision price to day close. The stacked bar at the fill shows the ₹3 per share of delay and impact paid on the 800 filled shares, and the taller coral bar shows the ₹6 per share of profit missed on the 200 that never filled. Brokerage and taxes add the fixed fees on top. Illustrative figures.
What looked like a clean entry on paper was always going to be smaller once the market had its say.The four parts it breaks into
The power of the measure is that the single number splits cleanly into named pieces, each pointing at a different stage of execution. The CFA Institute attribution decomposes the shortfall into delay, execution, and opportunity components, alongside the fixed fees of trading. Delay cost is the price drift between the decision and the order actually reaching the market. Trading cost, often called market impact, is the pressure the order itself puts on the price as it consumes the available depth. Opportunity cost is the profit lost on the part of the order that never filled, because of an adverse move or thin liquidity. Fixed fees are the brokerage, taxes, and exchange charges that apply no matter what.
Running the numbers from Figure 1 through that split shows where the ₹4,000 total actually went on a 1,000-share order with a ₹5,00,000 paper value.
| Component | What it captures | Cost (₹) | In bps |
|---|---|---|---|
| Delay cost | Price drift before the order reached the market | 1,600 | 32 |
| Trading cost | The order's own impact as it filled | 800 | 16 |
| Opportunity cost | Profit lost on the 200 shares that never filled | 1,200 | 24 |
| Fixed fees | Brokerage, taxes, and exchange charges | 400 | 8 |
| Implementation shortfall | The total gap, paper minus real | 4,000 | 80 |
Illustrative figures.
Figure 2 stacks those four pieces into the total. The point of the decomposition is diagnostic: a shortfall driven by delay points to a slow signal-to-order path, one driven by trading cost points to orders that are too large for the book, and one dominated by opportunity cost points to a strategy that keeps reaching for fills it cannot get. The same 80 basis points mean very different things depending on which bar is tallest.
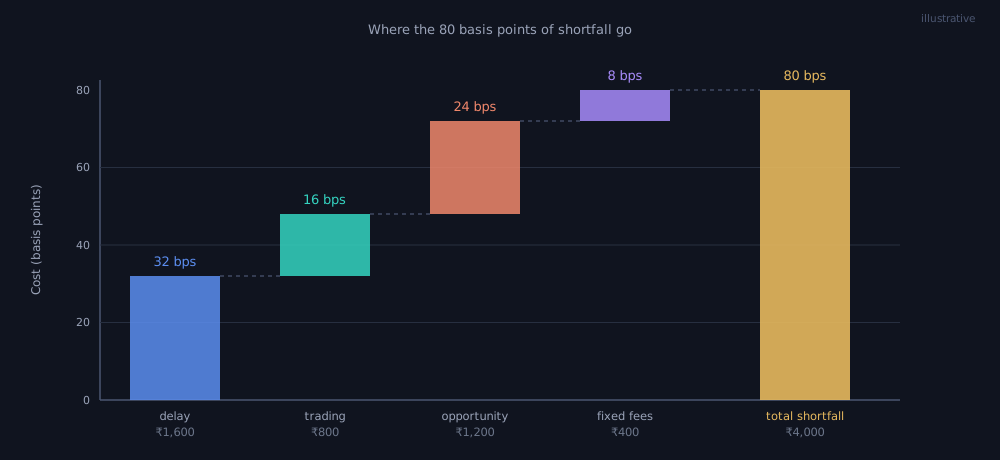
Figure 2: The same shortfall, broken into its parts. Delay, trading, opportunity, and fixed fees stack to the 80 basis point total. Illustrative figures.
The same 80 basis points mean very different things depending on which bar is tallest.Read that way, whichever component is largest points to a specific fix.
| Largest component | What it suggests |
|---|---|
| Delay cost | The signal-to-order path is too slow |
| Trading cost / market impact | The order size is too large for the available liquidity |
| Opportunity cost | The limit price or liquidity assumptions are too optimistic |
| Fixed fees | The strategy trades too frequently or at too small a size |
How to read it
Implementation shortfall is quoted in basis points and read as a cost, so smaller is better and the sign matters. A positive shortfall means the real portfolio trailed the paper one, the usual case. A negative shortfall means execution beat the decision price, which happens when the market moves in the trader's favour during the trade, and is pleasant but not something to design around. There is no universal threshold, because the figure scales with the instrument, the order size, and the urgency, but a strategy that needs immediate execution in a thin contract will always carry a larger shortfall than a patient one in a liquid index.
The reason there is no single right number is that the components pull against each other. Trading faster shrinks delay and opportunity cost, because the order reaches the market quickly and fills before the price runs away, but it raises market impact, because hurried orders push the price harder. Trading slower does the reverse. Robert Almgren and Neil Chriss framed this directly in their 2000 paper in the Journal of Risk, treating execution as a trade-off between the market impact of trading quickly and the timing risk of trading slowly. Reading an implementation shortfall well means reading that balance, not just the headline.
For a systematic trader the most useful reading is comparative. A shortfall measured the same way across many trades reveals whether a strategy's costs are stable or creeping, whether they spike in fast markets, and whether they grow with size in the square-root pattern that market impact tends to follow. One trade's shortfall is noise; the distribution across hundreds of trades is the signal.
Limits and pitfalls
The measure is only as honest as its decision price. The whole edifice rests on knowing the exact price at the instant the strategy committed, and if that timestamp is fuzzy or chosen after the fact, the shortfall can be quietly understated. A backtest that records the decision price as the same price it later assumes for the fill makes the shortfall vanish on paper, which is precisely the illusion the measure exists to break.
The cost a strategy never sees is the one most likely to sink it. Opportunity cost is the trickiest part, because it counts a profit that exists only in the paper portfolio: the gain on shares that were never bought. That is real money missed, but it depends entirely on the reference price chosen to value the unfilled order, and a flattering choice can hide it. Fixed fees, by contrast, are the easiest piece to measure and the easiest to forget to scale: a strategy that trades hundreds of times pays them hundreds of times. SEBI's study of the equity derivatives segment found individual traders paid more than ₹50,000 crore in transaction costs between FY22 and FY24, a reminder that the friction of trading is large and real, not a rounding error.
The cost a strategy never sees is the one most likely to sink it.A last caution: implementation shortfall measures the trades a strategy made, not the trades it should have made. It cannot tell you whether the original signal was good. A strategy can have a tiny, beautifully controlled shortfall and still lose money, because the decision itself was wrong. The measure grades execution, and execution alone. It belongs next to return and risk metrics, not in place of them.
A checklist before you trust implementation shortfall
Before trusting an implementation shortfall figure, ask:
- Is the decision price a real, timestamped price, not one chosen after the trade?
- Is the reference price for valuing unfilled shares stated and consistent?
- Are all four components present: delay, trading, opportunity, and fixed fees?
- Are fixed fees counted on every trade, not just once?
- Was the same method used across every trade being compared?
- Does the shortfall widen in fast markets or with larger orders?
- Is opportunity cost included when part of the intended order did not fill?
- Is the figure read alongside return and risk, not on its own?
A trading idea earns its real return only after the market has charged for the difference between intention and execution, and that charge is invisible in a backtest that assumes a perfect fill. Measuring implementation shortfall honestly, against a true decision price and across a full set of trades, is part of putting validation between an idea and live capital. That is the layer daZh by Zudora is built to be: the place a tested edge has to clear before it meets live capital, so an idea is measured on realistic ground rather than waved through on a perfect-fill assumption. A test cannot promise the next fill. But pricing the gap between paper and reality before any money is at stake is what lets a trader trust a backtest instead of just admiring it.
Frequently asked questions
What is implementation shortfall?
It is the difference between a paper portfolio that trades instantly at the decision price and the real portfolio that actually traded. It captures the full cost of turning an idea into a position, from the delay before an order is placed to the shares that never fill.
What is the implementation shortfall formula?
Paper return minus real return. The paper portfolio buys the full order at the decision price; the real portfolio buys only the filled shares at the prices paid, minus fees. The gap is usually divided by the size of the paper position and quoted in basis points.
What is the difference between slippage and implementation shortfall?
Slippage is the gap between an expected fill price and the realized one, which sits inside the delay and trading pieces of the shortfall. Implementation shortfall is wider: it also counts the profit lost on shares that never filled and the fixed fees, both of which slippage ignores.
What are the components of implementation shortfall?
Four named pieces: delay cost, the price drift before the order reaches the market; trading cost, or market impact, the pressure the order puts on the price as it fills; opportunity cost, the profit lost on the part of the order that never filled; and fixed fees, the brokerage, taxes, and exchange charges.
How can implementation shortfall be reduced?
The components pull against each other: trading faster shrinks delay and opportunity cost but raises market impact, while trading slower does the reverse. Reading the decomposition shows which component dominates, so a slow signal-to-order path, orders too large for the book, or fills a strategy cannot get can each be addressed.
Why does implementation shortfall matter in a backtest?
A backtest that records the decision price as the same price it later assumes for the fill makes the shortfall vanish on paper. Measuring it against a true decision price, across a full set of trades, is what shows whether a tested edge survives real execution. Backtests rest on historical data and assumptions, and actual results may differ.
Related concepts
- Slippage, the execution-cost slice that lives inside the shortfall.
- Strategy validation, where execution costs are met on tested ground before capital.
- Out-of-sample testing, the check that an edge survives data it was not built on.
- How to Backtest an Options Strategy.
Disclaimer: daZh is a software platform for building, testing, and managing user-defined trading strategies. It does not provide investment advice, stock recommendations, guaranteed returns, or profit assurance. Backtests are based on historical data and assumptions; actual trading results may differ.
Sources
- André F. Perold, "The Implementation Shortfall: Paper versus Reality", The Journal of Portfolio Management, Vol. 14, No. 3, Spring 1988, pp. 4 to 9. https://jpm.pm-research.com/content/14/3/4
- CFA Institute, "Trade Strategy and Execution", CFA Program Level III refresher reading, 2026 curriculum. https://www.cfainstitute.org/insights/professional-learning/refresher-readings/2026/trade-strategy-execution
- Robert Almgren and Neil Chriss, "Optimal Execution of Portfolio Transactions", The Journal of Risk, Vol. 3, No. 2, Winter 2000, pp. 5 to 39. https://www.risk.net/journal-of-risk/volume-3-number-2-winter-2000
- SEBI, "Analysis of Profits and Losses in the Equity Derivatives Segment (FY22-FY24)", study, September 23, 2024. https://www.sebi.gov.in/reports-and-statistics/research/sep-2024/study-analysis-of-profits-and-losses-in-the-equity-derivatives-segment-fy22-fy24-_86905.html