
The modern Indian equity market is not best understood as a simple story of rising participation or rising valuations. It is better understood as a layered system with two very different faces. At its core sits an increasingly sophisticated market infrastructure: near-₹465 lakh crore listed market capitalisation, deep benchmark liquidity, full T+1 cash settlement, large depository penetration, record mutual-fund intermediation, and a market-quality profile in benchmark names that is attractive to systematic, quantitative and institutional capital. At the edge sits a very different market: under-penetrated households, strong preference for capital preservation, heavy reliance on intermediaries, and repeated pockets of speculative intensity in IPOs, small-caps and short-dated derivatives.
The first rule of stock markets, in India as anywhere else, is deceptively simple: know which market you are actually trading in. For the serious practitioner, that is not trivia. It is the first filter through which every other decision, whether allocation, execution, or risk budgeting, has to pass.
The architecture of the Indian equity market
If you are allocating capital in Indian equities today, three things are true at once: the macro is supportive, the infrastructure is strong, and the participant pool is deeper than it has ever been. None of this tells you which market you are in.
The macro backdrop remains supportive. According to MOSPI, real GDP growth for FY 2025-26 has been estimated at 7.6 per cent, with nominal GDP growth at 8.6 per cent under the new base-year series. Indian listed equities remain one of the country's most visible transmission mechanisms from domestic savings to productive capital.
The market's scale is now unmistakable. NSE reported market capitalisation of ₹464.74 lakh crore on 20 April 2026, while BSE reported market capitalisation of ₹465.64 lakh crore and 5,116 companies with listed equity capital. These are not just large numbers; they signal the extent to which India's equity market has become systemically relevant to savings behaviour, asset allocation, and corporate finance.
The investor base has widened sharply. NSE said unique registered investors reached 12.7 crore as of 31 January 2026. At the depository layer, CDSL reported 18,01,23,835 investor accounts as of 31 March 2026, while NSDL reported 4,43,89,501 investor accounts on the same date. Taken together, that is roughly 22.45 crore demat accounts. The distinction matters: investor accounts are not the same as unique investors, and India's market can therefore look both deeply penetrated and still behaviourally shallow at the same time.
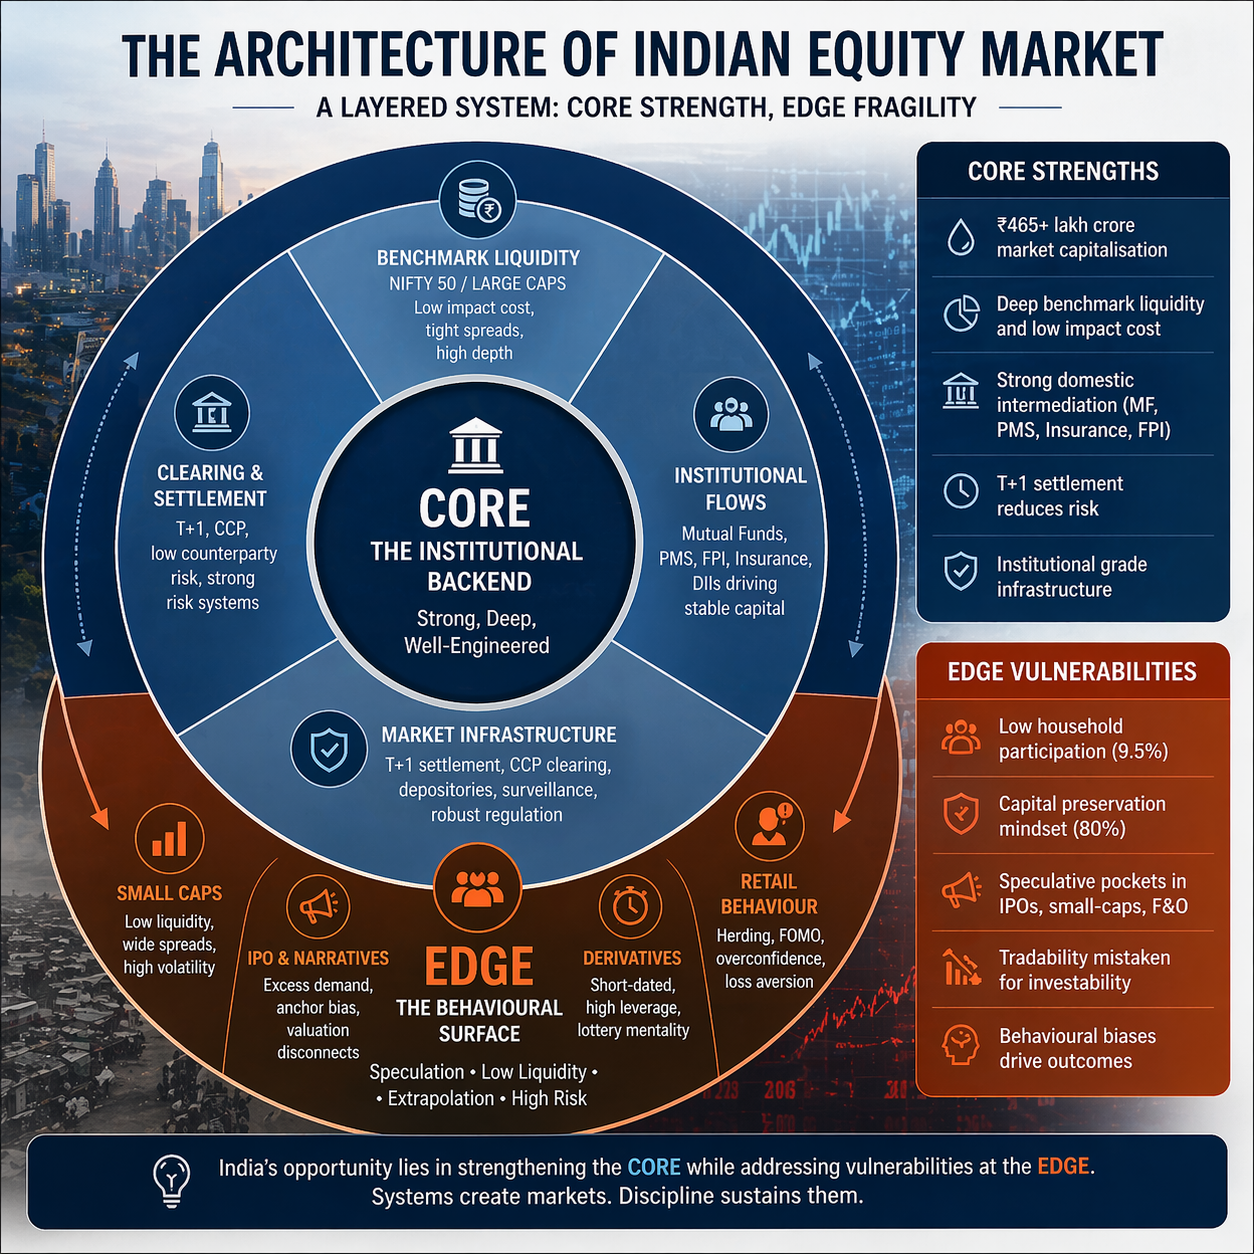
Figure 1: India's market has the scale of a large emerging-market equity complex, but the decisive question is not size. It is whether the scale translates into durable, well-distributed participation.
Domestic intermediation has become a counterweight to foreign cyclicality. AMFI reported total mutual-fund AUM of ₹73.73 lakh crore in March 2026, equity AUM of ₹31.98 lakh crore, passive-fund AUM of ₹14.12 lakh crore, 27.39 crore folios, and record monthly SIP contributions of ₹32,087 crore. At the more affluent end of the product spectrum, SEBI reported portfolio-manager assets of ₹41.42 lakh crore as of March 2026; even excluding EPFO/PF money, non-EPFO/PF PMS assets were about ₹7.99 lakh crore. The institutionalisation of domestic savings is no longer aspirational. It is already visible in the data.
The market's operating backbone is also unusually strong by emerging-market standards. Full T+1 rolling settlement in the equity segment became effective from 27 January 2023 for all remaining securities. This matters because it lowers settlement risk, shortens counterparty exposure, and reinforces the credibility of the cash market as the anchor for broader price discovery.
Indian equity market snapshot
The behavioural paradox of the Indian investor
The most striking fact about India's equity culture is that it is both cautious and speculative. The SEBI Investor Survey 2025 shows that only 9.5 per cent of households participate in securities-market products, 91 per cent are non-investors, and 80 per cent prioritise capital preservation. Yet this surface conservatism coexists with rapid growth in trading accounts, strong social visibility of equities, and repeated surges in the most behaviourally sensitive corners of the market. This is not a contradiction. It is a segmentation story: long-term participation remains shallow, while high-intensity participation is concentrated in digitally enabled cohorts and market episodes.
Academic evidence supports this diagnosis. Research in Global Business Review finds robust evidence of overconfidence and the disposition effect in the Indian equity market during 2006-2013. An Indian Institute of Management Ahmedabad working paper later showed that the "price path" experienced by traders significantly affects the intensity of disposition bias: favourable price paths reduce the bias, while unfavourable paths intensify it. More recent evidence from the International Review of Economics and Finance finds that stock-specific sentiment in the Indian market slows the speed of price adjustment, while investor attention partially offsets that effect. Put simply, Indian prices can be efficient, but they are not behaviour-free; attention improves efficiency, sentiment degrades it.
Official data reinforce the same pattern in practice. SEBI's 2024 updated derivatives study found that 93 per cent of individual traders in equity F&O incurred losses between FY22 and FY24, with aggregate losses above ₹1.8 lakh crore. Reuters later reported, citing a subsequent SEBI study, that net losses for individual traders widened by 41 per cent to ₹1.06 trillion in FY25 even after regulatory tightening, while index-options premium turnover fell 9 per cent year on year. This is the clearest empirical sign that participation growth alone does not equal market maturation.
Access has scaled faster than judgement.The survey evidence also shows why institutional intermediation matters. SEBI's Investor Survey 2025 notes that 61 per cent of clients approaching mutual-fund agents are fully dependent on intermediaries for advice and execution, and that familiarity with complex products such as F&O, corporate bonds, AIFs and REITs is far below familiarity with mutual funds and shares. That asymmetry matters because it creates a market in which the most liquid and institutionally tractable products are not always the products most enthusiastically adopted by newly active investors.
Behavioural biases and the Indian expression
| Bias | How it appears in India | Institutional response already visible |
|---|---|---|
| Overconfidence | High trading frequency, especially in derivatives and hot IPO themes | Product restrictions, lot-size and expiry reforms, tighter surveillance |
| Disposition effect | Investors sell winners too early and hold losers too long | Greater use of goals-based MF and advisory channels; model portfolios |
| Sentiment extrapolation | Narrative-led swings in IPOs, midcaps, thematic trades | Passive and SIP channels act as slower, rules-based counterweights |
| Reliance on intermediaries | Investors outsource decision-making without always understanding product complexity | Suitability norms, disclosures, investor education, platform nudges |
| Loss aversion | Under-participation in equities at the household level despite rising account access | SIPs, diversified funds, target-risk constructions |
Cases from the market
Three episodes capture the market's central tension: narrative intensity at the edge, system strength at the core, and growing domestic counter-cyclicality.

Figure 2: Three episodes between 2021 and 2026 showing how narrative, microstructure and systematic flows each told a different story about the same market.
The Paytm repricing
When One 97 Communications listed on 18 November 2021 after a ₹18,300 crore IPO priced at ₹2,150 per share, it represented the high-water mark of narrative confidence in India's digital-platform story. By 20 April 2026, the stock was trading at ₹1,173.55, still roughly 45 per cent below its IPO price. The repricing is not evidence that India mispriced technology permanently; it is evidence that the market initially overpaid for optionality when the line of sight to durable profitability was weak. The subsequent operating improvement reported by the company, including a profitability milestone in FY25 and stronger EBITDA/PAT trends into FY26, shows that the market ultimately demanded evidence rather than vision alone.
Narrative can dominate discovery. Fundamentals reclaim it.
The analytical lesson is sharper than the anecdote. Anchoring to the issue price and extrapolating platform scale into immediate equity value proved unreliable. In India's market, especially in celebrated IPOs, narrative can dominate discovery in the first act, but fundamentals usually reclaim the final act. That is exactly the kind of environment in which disciplined post-listing accumulation, rather than listing-day enthusiasm, is more likely to create alpha.
The retail derivatives boom and regulatory reset
The second case is not a company but a market design event. SEBI's studies on retail activity in equity derivatives showed that 93 per cent of individual traders lost money over FY22-FY24, with aggregate losses above ₹1.8 lakh crore; Reuters later reported that those losses widened to ₹1.06 trillion in FY25 even after regulatory measures, though index-options premium turnover declined 9 per cent year on year. This is one of the clearest examples anywhere in the world of a market whose infrastructure can be world-class while end-user product outcomes remain poor for a large cohort.
The deeper point is structural. India's derivatives markets are highly scalable, electronically deep and attractive to systematic participants precisely because benchmark liquidity, clearing infrastructure and rules have improved. But those same qualities can make short-dated options appear deceptively approachable to retail traders. The systematic edge is therefore not merely faster code or better models; it is also product selection and path discipline. Institutions cluster where impact cost is low and execution is reliable. Many individuals cluster where convexity is exciting and holding periods are short.
The same market, two different markets. That is not a metaphor. It is a measurable fact.
The March 2026 correction and the rise of domestic resilience
The third case is March 2026. AMFI's monthly note recorded that the Nifty 50 fell 11.3 per cent and the Sensex 11.5 per cent in the month, helping drive a 10.1 per cent month-on-month decline in mutual-fund AUM through mark-to-market losses. Yet equity funds still recorded positive inflows of ₹40,450 crore, and SIP contributions rose to a record ₹32,087 crore from 9.72 crore active SIP accounts. This was the Indian market's most important recent behavioural signal: in a serious drawdown, the retail-investor response was not only panic selling. A large part of it was rules-based continuation.
That does not mean behaviour has disappeared. It means behaviour is becoming bifurcated. Tactical traders still display fear and recency bias; long-horizon investors using systematic plans increasingly do not. In practical capital-market terms, SIPs have become more than a distribution format. They are now a market stabiliser. For a country once seen as structurally dependent on foreign portfolio flows for secondary-market depth, that is a meaningful shift.
Comparing the three cases
| Case | What happened | What it reveals |
|---|---|---|
| One 97 Communications IPO | Large, high-profile platform IPO repriced sharply after listing before operational metrics improved | Anchoring and narrative extrapolation can overwhelm near-term valuation discipline in IPOs |
| Retail equity derivatives boom | Large retail participation coexisted with persistent losses | Product complexity exceeded capability for many participants; systematic participants benefited from better product fit |
| March 2026 correction | Equity prices fell sharply, but systematic domestic flows continued | India's market is gaining a domestic, rules-based stabiliser through SIPs and fund inflows |
Market quality, execution and the cost stack
If the first rule is knowing which market you are in, the second discipline is respecting where it actually lives.
If one were to judge India only by its most liquid large-cap segment, the market would look exceptionally strong. The Nifty 50 represented about 54.10 per cent of the free-float market capitalisation of NSE-listed stocks as of 30 September 2025; its constituents accounted for about 26.84 per cent of all traded value on NSE over the preceding six months; and the impact cost for a ₹50 lakh portfolio was just 0.02 per cent in that month. Even the Nifty Next 50 showed an impact cost of only 0.03 per cent for a ₹25 lakh portfolio. These are not marginal details. They are the foundation of India's attractiveness to passive funds, quant strategies, index arbitrage and execution-sensitive institutions.
This concentration has two consequences. First, the benchmark core is markedly more efficient than the broader market narrative often implies. Second, outside that core, the investor experience can deteriorate quickly as liquidity thins, price discovery becomes more narrative-driven, and behaviour overwhelms depth. In other words, the infrastructure is not uniformly weak; it is unevenly translated into investor outcomes. The institutional market already knows this. Much of retail India is still learning it.
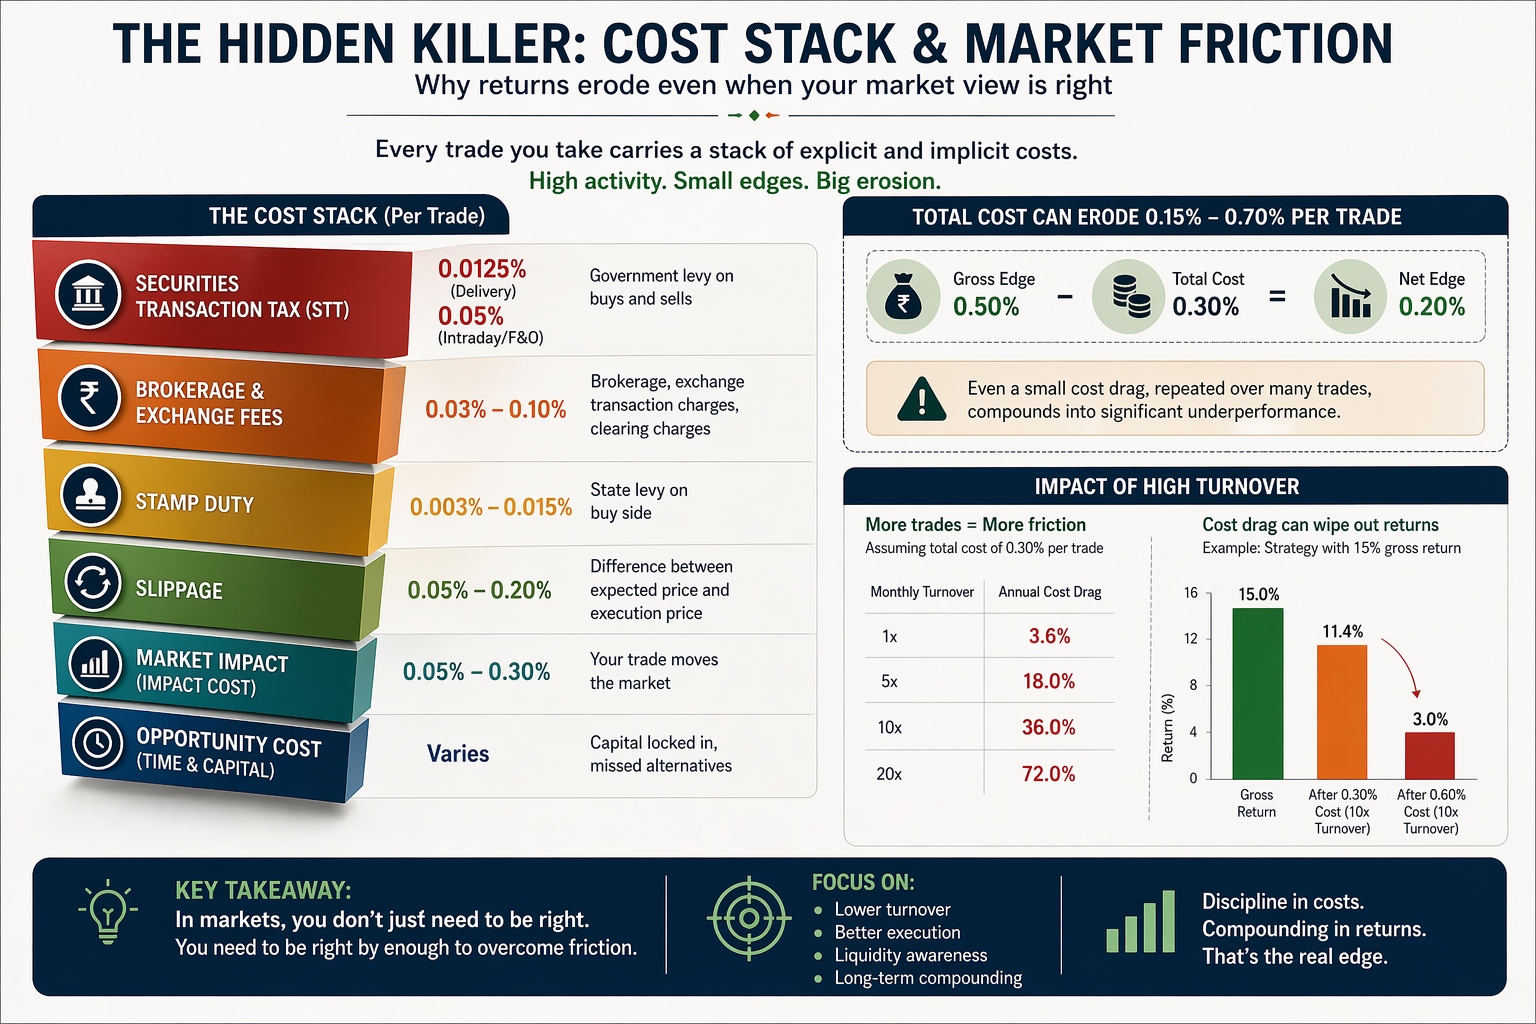
Figure 3: India's market quality is excellent at the benchmark core and degrades measurably beyond it. The cost stack adds friction exactly where casual turnover is highest.
India's explicit transaction-cost stack also matters more today than it did a few years ago. On stamp duty alone, the buyer pays 0.015 per cent for delivery-based equity transfers, 0.003 per cent for non-delivery trades, 0.002 per cent on equity futures and 0.003 per cent on equity options. From 1 April 2026, Finance Act 2026 raised securities transaction tax on the sell side in equity derivatives to 0.05 per cent for futures and 0.15 per cent for options. Separately, NSE's February 2026 circular raised exchange transaction charges effective 1 April 2026 by ₹20 per crore of traded value in cash equities, ₹10 per crore in equity futures, and ₹300 per crore of traded premium in equity options, alongside higher contributions to the investor protection fund.
High turnover no longer forgives weak strategy.The cash market has also become more discipline-oriented through operating rules. T+1 settlement is fully in place, and trading members in the capital-market segment must collect a minimum 20 per cent upfront margin in lieu of VaR and ELM from clients. Those measures may appear procedural, but they are essential to understanding why India's market infrastructure has become a comparative strength: counterparty risk is lower, funding discipline is higher, and the system is harder to destabilise through weak plumbing alone.
Current volatility illustrates the same point. India VIX was at 18.79 on 21 April 2026, elevated relative to complacent conditions but nowhere close to crisis extremes historically associated with genuine systemic fear. Combined with the March 2026 episode, the signal is that India is experiencing a repricing cycle, not a breakdown of market function. That distinction is crucial for both allocators and regulators.
Market-quality and cost indicators
| Indicator | Latest verified reading | Interpretation |
|---|---|---|
| Nifty 50 impact cost | 0.02% for ₹50 lakh portfolio | Benchmark liquidity is strong enough to support institutional and systematic execution efficiently |
| Nifty Next 50 impact cost | 0.03% for ₹25 lakh portfolio | Liquidity broadens beyond Nifty 50, but at a measurable step-down in depth |
| Delivery equity stamp duty | 0.015% on buyer | Long-only equity remains relatively inexpensive but not frictionless |
| Non-delivery equity stamp duty | 0.003% on buyer | High-turnover cash trading still accumulates explicit cost quickly |
| STT on equity futures from 1 Apr 2026 | 0.05% on seller | Derivatives churn has become more expensive |
| STT on equity options from 1 Apr 2026 | 0.15% on seller | Short-dated speculative activity faces a meaningfully higher friction layer |
| Minimum upfront cash-market margin | 20% | Risk controls now bite earlier at the client level |
| Full T+1 cash settlement | Effective 27 Jan 2023 | Market plumbing is among the strongest visible features of Indian market design |
The Invisible Scaffold
Which returns us to the opening question. India is not one equity market; it is at least three. There is a benchmark market with strong liquidity and low implementation slippage. There is a broad secondary market where liquidity is available but fragile. And there is a speculative market of narratives, IPOs and short-horizon derivatives where behavioural errors dominate. For the serious practitioner, successful allocation in India depends on knowing which of those markets you are actually in. The largest single mistake, and it is a repeatable one, is to apply benchmark assumptions to non-benchmark behaviour.
Two structural facts now shape everything else. First, domestic flows are strategically important, not merely supportive. The record SIP contributions and positive equity-fund inflows during the March 2026 pullback suggest India's domestic bid has matured from a cyclical participant into a structural stabiliser. Foreign flows can still amplify short-term volatility; they are less likely than before to define the market's medium-term clearing level on their own. Second, the regulatory frontier has moved from disclosure to product-capability alignment. Mass access to complex convex products without strong suitability rails produces persistently poor outcomes. That is not a speculative thesis; it is what the SEBI derivatives studies already document. The next stage of market development will be decided less by how many new accounts open and more by how well the infrastructure underneath those accounts is matched to the instruments people actually trade.
The enduring point is strategic. India's equity market is often described as "retail-led". That is only partly right. India's market is increasingly retail-accessed but institutionally scaffolded. The visible energy comes from new investors, digital platforms and trading culture. The invisible resilience comes from exchanges, depositories, fund SIPs, tighter margin rules, shorter settlement cycles, benchmark liquidity and domestic institutional pools. The long-run quality of Indian equities will depend less on whether participation continues to rise, since it almost certainly will, and more on whether that invisible scaffolding continues to convert access into durable capital formation.
That scaffolding is also what DAZH is designed to extend to the serious individual practitioner. Retail access has scaled faster than access to process. DAZH gives traders the same backtesting rigour, optimization surface, cost-aware modelling and risk governance that professional desks take for granted, expressed through a visual, no-code workflow built around NSE and NFO mechanics. In a market where the institutional core is already world-class, the next leg of edge outside that core is not better intuition. It is better process, systematically enforced. The platform is live at www.zudora.in.
India's infrastructure is not the edge. But without it, no edge will survive the behavioural layer above it.