
India is no longer a market where "quant" means only low-latency execution or statistical arbitrage. It is a layered system: a deep exchange-and-depository backbone, a retail-heavy derivatives culture, fast-growing mutual-fund and household participation, and a still-evolving bridge between institutional-grade signal design and retail-facing product packaging. That combination creates unusually rich alpha opportunities, but it also makes crowding, execution slippage, behavioural spillovers and regulatory change more important in India than in many developed markets.
For the serious practitioner, the reframe is blunt. In India, quant is not primarily about signals. It is signal plus microstructure plus cost control, in that order. If a signal cannot survive the local fee stack, the venue queue and the behavioural crosswinds above it, the model is not alpha. It is an accounting error dressed in Python.
Market architecture and scale
If you are building a quant book for Indian equities today, the first thing to internalise is that the venues you operate on are not uniform, and the second is that the scale of retail participation around those venues has changed what signal decay looks like.
India's exchange architecture now supports institutional-grade quant work, but in a way that is unusually asymmetric. The headline market-cap numbers for NSE and BSE are similar because most major Indian companies are cross-listed across the two venues; the economically important divergence is in trading concentration, not issuer breadth. NSE dominates current cash-market turnover and listed derivatives activity, while BSE remains strategically relevant for listing breadth, benchmark formation, and as a routing destination where spreads and queue conditions occasionally improve realised execution. NSE-listed market capitalisation stood at about ₹464.74 lakh crore on 20 April 2026; BSE-listed market capitalisation was about ₹4,65,64,462 crore across 5,116 listed equity companies. On 17 April 2026, NSE's cash-market turnover snapshot was ₹61,629.48 crore versus BSE's ₹10,101.13 crore, implying an approximate 85.9 per cent share for NSE in that day's combined cash turnover. In equity derivatives, the same day's snapshot showed 8.23 crore contracts on NSE against about 1.24 crore on BSE.
A second structural fact is the scale of household financial intermediation. A 2024 SEBI working paper reported that household gross savings through the securities market grew from ₹3.4 lakh crore in FY19 to ₹8.3 lakh crore in FY24, lifting the securities-market share of household gross financial savings from 16 per cent to 31.2 per cent. Combined depository accounts at CDSL and NSDL were roughly 22.45 crore as of 31 March 2026. The Indian mutual-fund industry's assets under management stood at ₹73.73 lakh crore on 31 March 2026, with average AUM for March 2026 at ₹79.46 lakh crore. This is exactly the kind of ownership shift that supports factor investing and passive smart-beta proliferation, but it also raises the risk that historically profitable signals become more crowded and slower to mean-revert.
Indian quant operating snapshot
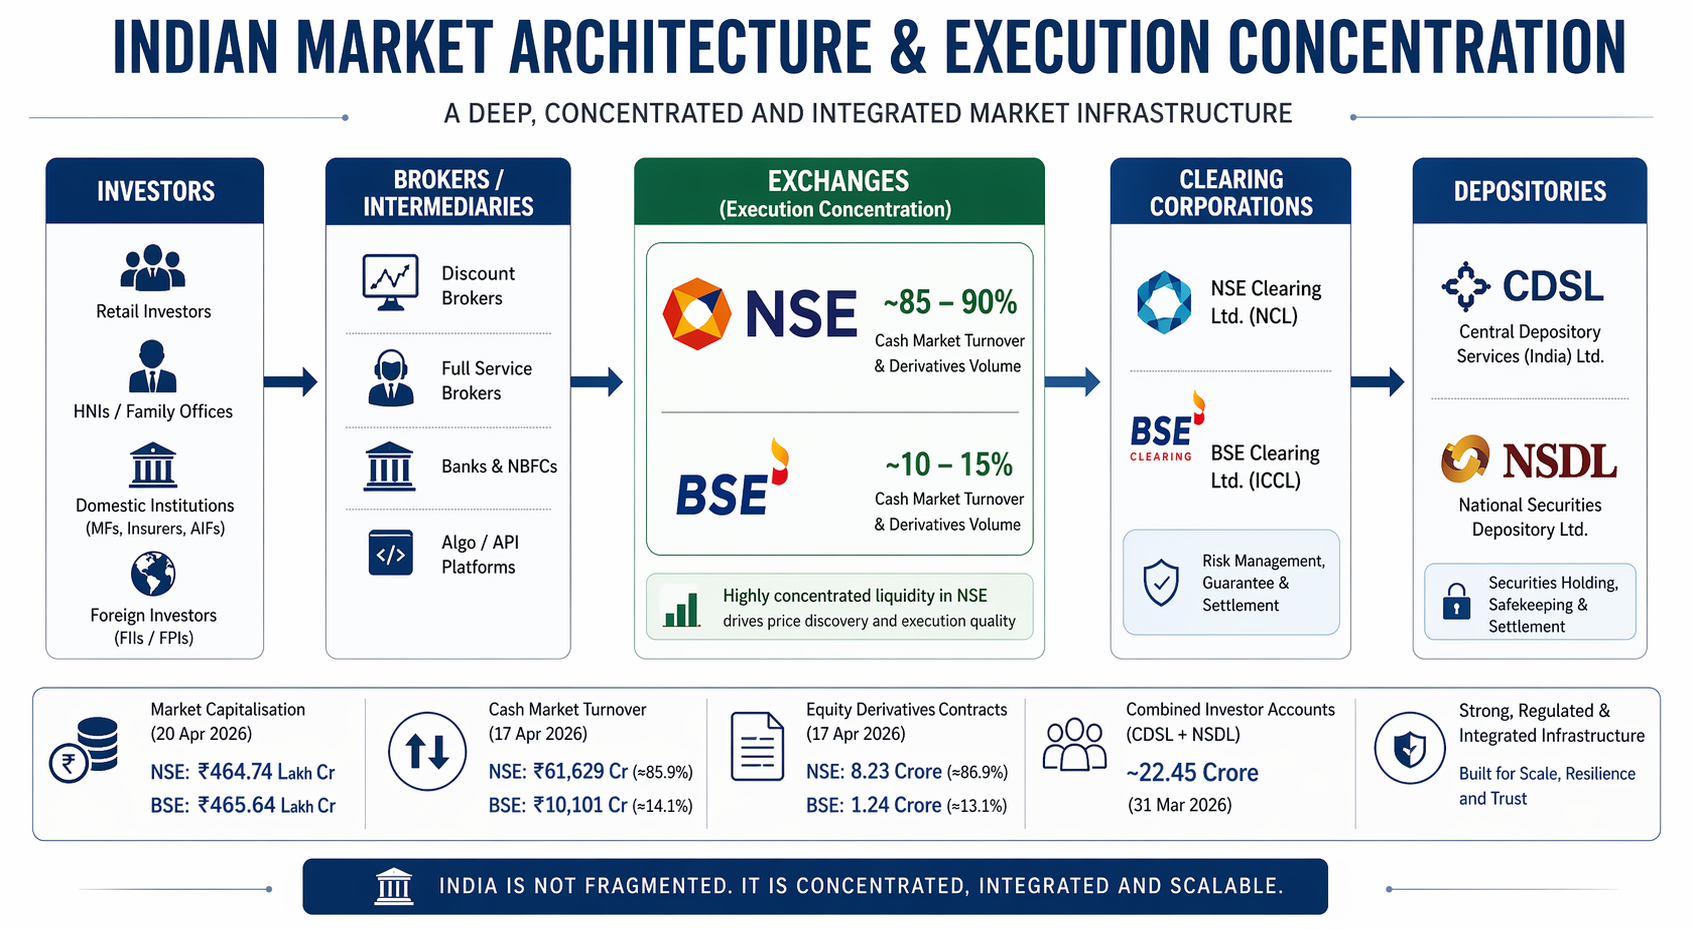
Figure 1: India's exchanges look similar on issuer breadth and headline market cap. They diverge sharply on realised trading concentration. The second picture is the one that matters for execution.
India's microstructure is now more explicitly quantitative than it was even two years ago. In the NSE cash market, price-linked tick sizes were introduced in 2024, replacing the earlier near-uniform ₹0.05 framework for many instruments: securities below ₹250 trade with a ₹0.01 tick, then move through ₹0.05, ₹0.10, ₹0.50, ₹1.00 and ₹5.00 bands as price levels rise; stock options continue to trade with a ₹0.05 tick. In index derivatives, the key lot sizes were revised effective late 2025, with Nifty 50 at 65, Bank Nifty at 30, FINNIFTY at 60, MIDCPNIFTY at 120, and Nifty Next 50 unchanged at 25. India also retains market-wide circuit breakers at 10 per cent, 15 per cent and 20 per cent. These changes are not cosmetic. They alter spread behaviour, hedging granularity, and the capital required to express short-horizon signals.
Execution in India must therefore be analysed as a queueing problem as much as an alpha problem. NSE publicly provides co-location services for high-frequency trading, tick-by-tick multicast data, and multiple protocol layers for members. SEBI has long permitted smart order routing, but public statistics on SOR adoption remain unspecified; what is visible is the regulatory emphasis on approval, auditability and order-to-trade controls. The upshot is that the best Indian execution stack is no longer simply fast. It is fast, cost-aware, compliant, and venue-adaptive.
A useful liquidity benchmark is the Nifty 50 itself. NSE states that the impact cost of a ₹50 lakh Nifty 50 basket was 0.02 per cent for September 2025, and that inclusion standards for the index require an average impact cost of 0.50 per cent or less for 90 per cent of observations over six months on a ₹10 crore basket. The core of India's market is liquid enough for systematic scale. The edge erosion begins the moment one moves down the breadth curve or into more crowded short-dated derivatives.
That is the terrain. The signal problem sits on top of it.
In India, quant is signal plus microstructure plus cost control.Alpha, costs and construction
If you are running a factor sleeve in India, the first thing to notice is that the menu is already written. The second is that the tick, lot and queue mechanics beneath it decide how much of the menu you actually get to eat.
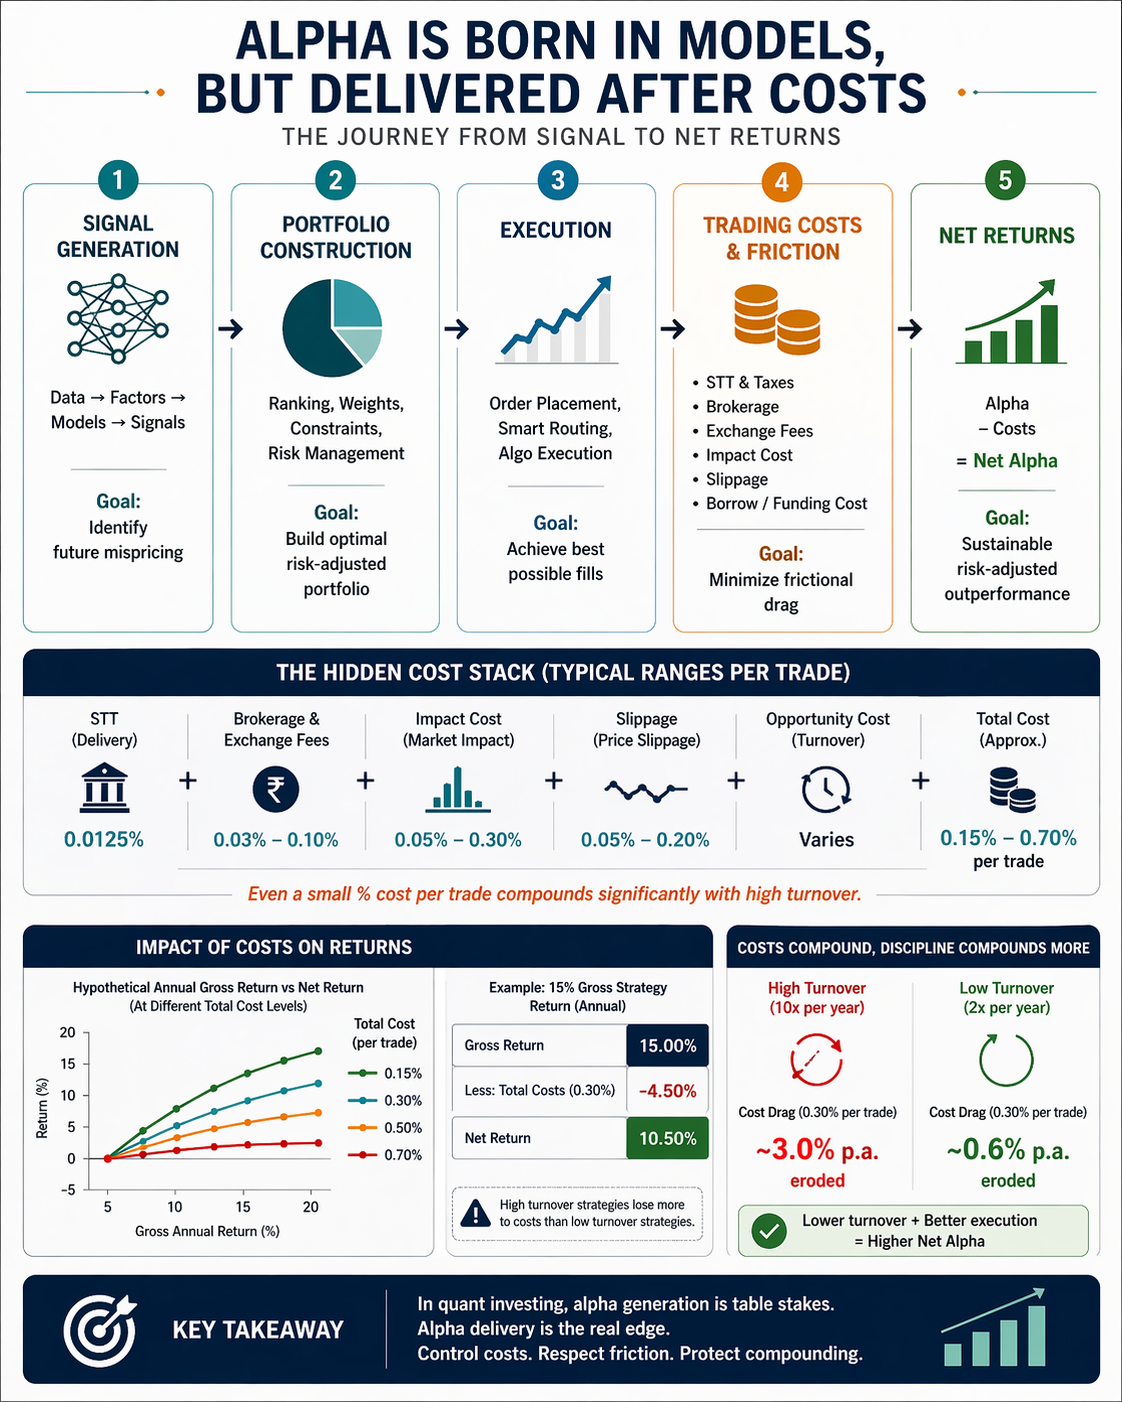
Figure 2: Tick bands, lot revisions and co-located queue mechanics together define the real capital requirement of a short-horizon signal in India. Alpha that ignores them is not alpha.
The alpha menu in Indian equities is broad, but its investable expression is narrower than the raw academic literature suggests. NSE's own strategy-index documentation makes the point clearly: Indian factor implementation is already operationalised around momentum, quality, value, low volatility and multi-factor combinations, usually with investability and free-float screens layered in. Momentum is generally volatility-adjusted using 6-month and 12-month price-return inputs; quality, value and low-volatility variants are similarly codified in index methodology. In practice, the market's official factor grammar is already well known. Alpha therefore comes less from discovering factors than from timing, portfolio construction, signal interaction, and turnover discipline.
Recent academic work still suggests that classic factors remain alive in India, even if cyclicality is severe. A 2025 SSRN study found persistent price-momentum behaviour in Indian equities; another recent study using Fama-French style construction reported positive value and momentum premia over long samples; and newer work on Indian factor timing argues that structural and valuation components can diverge materially across regimes. At the same time, research on persistence and mean reversion in Indian markets continues to show that regime shifts are common, especially after stress episodes or valuation overshoots. Momentum works in India, but it is rarely safe to own momentum without a valuation, liquidity or quality governor.
The cost side is where many Indian quant strategies quietly fail. Explicit statutory charges are easy to underestimate because they look small in isolation. NSE's investor-facing tax pages list stamp duty at 0.015 per cent on delivery trades, 0.003 per cent on non-delivery cash trades, 0.002 per cent on equity futures, and 0.003 per cent on equity options, all on the buy side. Securities-transaction tax adds another layer, and exchange transaction charges were revised again in 2026. These frictions are manageable for lower-turnover factor portfolios. They are lethal for signals whose gross edge is measured in a few basis points per trade.
If a signal cannot survive the fee stack, it is not alpha.A useful way to frame Indian portfolio construction is therefore as a four-part problem: first, signal ranking; second, tradability screening; third, tax-and-fee-aware turnover budgeting; fourth, ownership and crowding control. Crowding matters because domestic mutual-fund ownership in Nifty 50 companies reached a record 13.0 per cent in the June 2025 quarter, while FPI ownership was 24.5 per cent. That is not yet a crisis, but it is a warning. When domestic flows pile into the same quality, momentum or large-cap themes, ranking models need stronger diversification constraints by sector, factor cluster, and common-ownership channels.
Indian trading cost stack
| Cost component | Public rate or status | Strategy implication |
|---|---|---|
| Stamp duty, cash delivery | 0.015% on buyer | Penalises unnecessary churn in delivery portfolios |
| Stamp duty, cash non-delivery | 0.003% on buyer | Less punitive, but still meaningful for high turnover |
| Stamp duty, equity futures | 0.002% on buyer | Small in isolation; material at scale |
| Stamp duty, equity options | 0.003% on buyer | Particularly relevant for frequent options rolling |
| STT / transaction charges | Applicable; rates vary by product, revised in 2026 | Must be embedded in pre-trade cost estimates |
| Smart order routing statistics | Unspecified publicly | Best execution must be validated broker by broker |
Cases from Indian quant practice
For the allocator evaluating an Indian quant product, the first question is never the trailing return. It is which of four strategy classes you are actually being pitched, because the label "quant" is stretched across genuinely different machines.
DSP Quant Fund
The first case is a classic rules-based Indian mutual-fund implementation. DSP Quant Fund describes itself as a rules-based model for stock selection. In its January 2026 factsheet, its 1-year return was 8.97 per cent, slightly ahead of the BSE 200 TRI at 8.55 per cent, but its 3-year and 5-year annualised returns of 13.32 per cent and 11.46 per cent trailed the benchmark's 16.18 per cent and 16.04 per cent respectively. Since inception from 10 June 2019, the fund showed 13.49 per cent versus 14.80 per cent for the benchmark. The lesson is not that rules fail. It is that a clean rule set can reduce behavioural error and still underperform if the market regime favours concentrated sector leadership or valuation re-rating over diversified factor harvesting.
A clean rule set reduces error. It does not guarantee capture.
Kotak Quant Fund
The second case is a newer quant fund with a shorter live record. Kotak Quant Fund is positioned as an open-ended equity scheme following a quant-based investing theme. Public fund-page data show since-inception CAGR of 16.11 per cent and a 1-year return of 4.75 per cent for the direct-growth option, against 6.20 per cent for the Nifty 200 TRI comparator on the same display. The live-history problem is central in India: many quant products are still too young to have experienced a full domestic cycle of liquidity boom, post-election rotation, valuation compression and rate adjustment. That makes process transparency and turnover discipline more important than raw trailing return when institutional allocators underwrite such products.
quant Multi Cap Fund
The third case is a dynamic quantamental rotator. quant Multi Cap Fund frames its process around a VLRT architecture: valuation, liquidity, risk appetite and timing. Public factsheet material reported cumulative return of more than 442.92 per cent between 24 March 2020 and 31 October 2025, and acknowledged that portfolio turnover is naturally high because portfolios are dynamically rebalanced by risk-on and risk-off assessments. This is a distinctly Indian form of quant. Less like a static factor sleeve, more like a macro-liquidity timing engine with discretionary-looking outputs generated through a formal internal framework. It can produce eye-catching returns in strong dispersion regimes, but it also raises the classic institutional questions about replicability, turnover cost, and crowding.
One label. Four very different machines.
The co-located options market maker
A final case, best treated as anonymised, is the co-located index-options market maker. NSE offers co-location for high-frequency trading, provides tick-by-tick multicast data, and operates under order-to-trade rules that are explicitly designed to monitor order flooding. SEBI's post-study narrative on derivatives also makes clear that algorithmic participation captures the overwhelming bulk of profitable activity among foreign investors and proprietary traders in equity F&O. This strategy class does not live on signals in the usual asset-management sense. It lives on queue priority, inventory control, spread capture, event filtering, and disciplined cancellation behaviour. Public performance is unspecified, but the market-structure edge is visible.
Case comparison
| Case | Strategy form | Public evidence on performance | Key strength | Main vulnerability |
|---|---|---|---|---|
| DSP Quant Fund | Rules-based diversified stock selection | 1Y ahead of benchmark; 3Y / 5Y behind benchmark in Jan 2026 factsheet | Behavioural discipline; transparent model framing | Regime lag; benchmark-relative compression |
| Kotak Quant Fund | Quant-themed diversified equity | Since-inception CAGR 16.11%; 1Y 4.75% on public fund page | Clean productisation of quant exposure | Short live history |
| quant Multi Cap Fund | Dynamic quantamental rotation | 442.92% cumulative from Mar 2020 to Oct 2025 | Strong capture of cycles and regime shifts | High turnover; replication questions |
| Anonymised options market maker | Co-located low-latency execution | Public performance unspecified | Spread capture, queue position, fast hedging | Regulatory change, fee changes, inventory shocks |
The comparison above mixes strategy families deliberately. In India, quant spans retail-packaged factor funds, dynamic macro-rotation systems, and latency-sensitive liquidity provision. Public comparability is therefore imperfect by design, and anyone evaluating the landscape has to know which of those buckets a given product is actually in before comparing trailing returns.
Behavioural frictions and algorithmic discipline
The strongest reason to care about algorithms in India is behavioural, not technological. SEBI's Investor Survey 2025 found that only 9.5 per cent of households participate in securities products, that participation is far more urban than rural, and that 80 per cent of households prioritise capital preservation. Older SEBI survey work also found that investors commonly interpret risk as danger or loss, while showing pockets of overconfidence and herd-like behaviour. Price discovery is increasingly digitised, but investor psychology remains highly uneven. That mismatch is fertile ground for systematic strategies.
At the same time, algorithms can amplify the very biases they are supposed to neutralise. The clearest evidence comes from the retail derivatives boom. SEBI reported that 93 per cent of individual traders incurred losses in equity F&O between FY22 and FY24, with aggregate losses above ₹1.8 lakh crore over three years; a later official study after recent curbs still found that 91 per cent of individual traders posted net losses in FY25. Reuters' summary of SEBI's work added an important institutional contrast: 97 per cent of foreign-investor profits and 96 per cent of proprietary-trader profits in FY24 F&O were generated through algorithmic trading. The implication is blunt. In India's options market, automation helps those with process discipline and infrastructure, and hurts those who use it merely to trade faster.
How algorithms cut both ways in India
| Behavioural issue | How algorithms mitigate it | How algorithms can amplify it |
|---|---|---|
| Loss aversion / disposition effect | Enforced stop rules and position budgets | Rapid averaging-down in leveraged options if code is poorly specified |
| Herding / FOMO | Pre-set entry criteria ignore social noise | Copy-trading and template algos synchronise retail flows |
| Overconfidence | Backtests expose weak intuition | Overfit strategies create false confidence and higher turnover |
| Recency bias | Signal smoothing and regime filters | Short-window momentum models chase crowded weekly-option moves |
| Home / sector bias | Factor models widen the eligible universe | Domestic-flow crowding still pushes models into the same large-cap leaders |
| Safety bias | Risk constraints limit ruin probability | Excess conservatism underinvests in genuine trend regimes |

Figure 3: The same market segment, two different participant experiences. Automation is not neutral. It reliably rewards process and reliably penalises its absence.
The mapping is an inference from SEBI household-behaviour evidence, derivatives-loss studies, and the retail-algo regulatory framework rather than a direct official taxonomy. The core point is well supported, however: automation is only as good as the risk architecture wrapped around it.
Automation is only as good as the risk architecture wrapped around it.The quant mind in India
Which returns us to the reframe the article opened with. In India, quant is not primarily about signals. It is about whether the architecture around a signal (the venue queue, the cost stack, the crowding monitor, the risk wrapper) can hold up when the market actually misbehaves. Backend capability and market design decide more than model sophistication. Indian quant is strongest where those two meet: liquid index-linked cash baskets, disciplined multi-factor portfolios, and exchange-native execution stacks. It is weakest where frontend productisation invites speed without process.
For the practitioner, the operating posture that follows is concrete. Design for Indian frictions rather than despite them. Use cash-market factor sleeves where liquidity is formally screened, and reserve short-dated options for strategies that genuinely rely on convexity or market making. Build every model with a turnover budget and a crowding monitor. Treat broker and OMS/EMS choice as an investment decision rather than a technology procurement, because the same directional model produces very different outcomes depending on routing logic, cancellation policy, and the venue-specific queue it reaches. That discipline now has a regulatory tailwind. SEBI's retail-algo framework and the updated order-to-trade regime are shifting the market from opaque speed to auditable speed, which rewards the processes practitioners were going to need anyway. The next gain will come from standardised public disclosure of order-cancellation intensity, retail-algo share by segment, and venue-level execution-quality benchmarks, because those metrics convert invisible infrastructure advantages into comparable ones.
This is also where DAZH fits. Most serious Indian practitioners lose their first year to infrastructure: a backtest runner, a cost stack, a venue-aware order model, an optimization loop. DAZH collapses that stack into a no-code surface where tick bands, lot revisions, statutory charges and slippage behaviour are already embedded in the engine. The practical consequence is that a trader's attention can move back up the chain, to regime judgement, turnover budgeting and crowding control, which is where durable Indian quant edge now lives. The platform is live at www.zudora.in.
The enduring point is the one the article opened with. Signals are easy. The architecture around them is not. In the Indian context, the best quant mind is not the fastest mind. It is the one that can price behaviour, friction, regulation and liquidity at the same time.